- Daily Energy Market Update
- Posts
- Heating Oil / WTI crack spread
August 18,2025
Overview
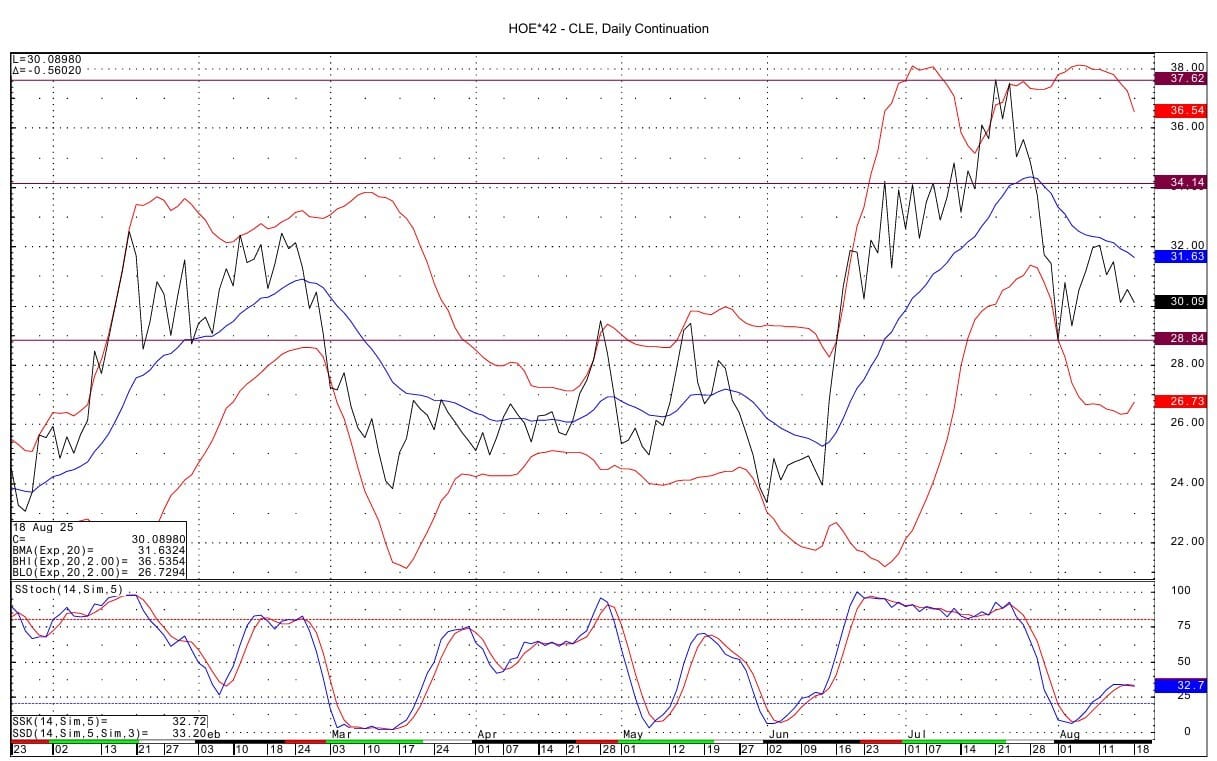
In early July ( in a report issued July 9), we suggested that the HO/WTI crack had peaked as demand was falling and supply was likely to increase as the refining margin was very advantageous. In the weeks that followed distillate supply rose quite a bit. In a 3 week span supply rose by 10.7 MMBBL, thus causing the crack to drop quite a bit. Tariff concerns have also weighed on the distillate complex for fear that industrial demand will fall. The spot futures crack has fallen back to $30 from a peak of near $37.50 in late July.
The low for the crack on a daily continuation chart basis seen 2 weeks ago was just below $29, where there is likely support when looking at lows from February this year. The crack may well stabilize under $30 as distillate inventories still remain 19% below the 5 year average, as per the DOE. Thus a range may be in order for the crack in the coming weeks as tariff concerns and some further possible downside for the flat price would act as negatives for the HO contract, while the worries over supply heading into winter will be supportive. The range we suggest for the spot crack is from near $29 to $34.
Notable on the DC chart is the fact that basis the DC chart, the .618 retracement from the low of $23.35 seen in early June to the high of $37.62 seen on July 21 is $28.81. The low seen on Aug 1 for the HO/CL crack on the DC chart was $28.84.
The suggestion we make of further possible downside for the HO flat price stems from the downward pattern we see on the weekly continuation chart.
The October HO/WTI crack has momentum on the daily chart that is slightly negative. Very strong support is seen from lows from late winter/spring 2024 at the $30 level and then again at the $29 level. The $30 price was tested on a spike low at the beginning of this month. Resistance comes in at the $34 area.


Enjoyed this article?
Subscribe to never miss an issue. Daily updates provide a comprehensive analysis of both the fundamentals and technical factors driving energy markets.
Click below to view our other newsletters on our website:
Disclaimer
This article and its contents are provided for informational purposes only and are not intended as an offer or solicitation for the purchase or sale of any commodity, futures contract, option contract, or other transaction. Although any statements of fact have been obtained from and are based on sources that the Firm believes to be reliable, we do not guarantee their accuracy, and any such information may be incomplete or condensed.
Commodity trading involves risks, and you should fully understand those risks prior to trading. Liquidity Energy LLC and its affiliates assume no liability for the use of any information contained herein. Neither the information nor any opinion expressed shall be construed as an offer to buy or sell any futures or options on futures contracts. Information contained herein was obtained from sources believed to be reliable, but is not guaranteed as to its accuracy. Any opinions expressed herein are subject to change without notice, are that of the individual, and not necessarily the opinion of Liquidity Energy LLC
Reply