- Daily Energy Market Update
- Posts
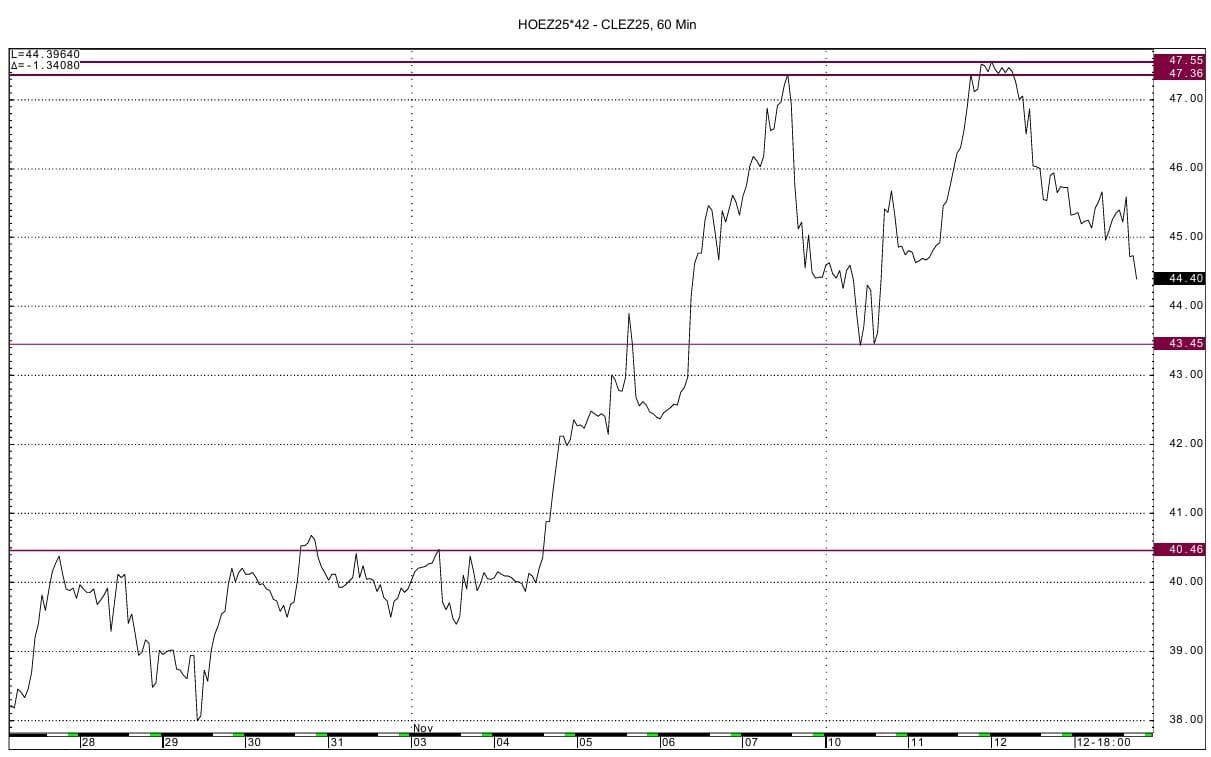
- December Heating Oil vs WTI crack spread
November 13, 2025
Overview
The December Heating oil WTI crack spread has seen volatile trading the last few sessions.
The crack spread rose to a fresh high on a daily settlement basis 2 days ago as continued attacks on Russian energy infrastructure and sanctions on Russian oil raised the fear of fuel oil supply disruptions thus supporting the refining margin. PVM's analyst said this week : "Fresh U.S. sanctions on major Russian oil producers and exporters are weighing on product exports. As a result, heating oil/gasoil and RBOB gasoline are moving in a different direction from crude.". European diesel refining margins rose to a close 2 days ago around 21-month highs of close to $31 per barrel. The front end (December) HO/CL crack on the CME rose to its best spot month value since February 2024, settling Tuesday at $47.14.
But, we have recently in our Daily Update cited how US refinery operations were running well behind the level seen one year ago and how we believed that the strong crack margins would incentivize refiners to ramp up operations, as well as the end of refinery maintenance work. This week's DOE data confirmed our belief. This week's DOE data has seen crude inputs to refineries rise sharply by 717 MBPD to 15.973 MMBPD. Yet, this still lags behind last year's crude input to refineries level for this week of 16.509 MMBPD. Both the strong refining margins and the end of normal refinery maintenance should lead to further increases in refinery runs in the coming weeks. This week's DOE data showed distillate output having risen by 319 MBPD to a very strong figure of 5.028 MMBPD. Additionally the IEA today said :" global refinery runs slumped by 2.9 MMBPD month on month to 81.5 MMBPD in October, but are set to increase sharply towards year-end. "
Technically, we see the crack spread as having peaked over $47, as we had suggested in the email we wrote last Friday. The 60 minute chart shows highs from last Friday at $47.35 and from 2 days ago at $47.55. These highs thus tested the resistance from the DC chart at $47.20-47.25 from data from February 2024 and October 2023, which we cited in the email sent last Friday. Momentum basis the daily chart for the crack spread has turned negative from an overbought condition.
We see support likely at the $43.45 and then $40.45 levels. The $40 area was prior resistance before the recent breakout to the fresh highs seen in recent days. A return to values much below $40 seem unlikely given the overall tone of the market suggesting as the IEA said today :" Middle distillate markets appear particularly tight with limited potential for relief. "


Enjoyed this article?
Subscribe to never miss an issue. Daily updates provide a comprehensive analysis of both the fundamentals and technical factors driving energy markets.
Click below to view our other newsletters on our website:
Disclaimer
This article and its contents are provided for informational purposes only and are not intended as an offer or solicitation for the purchase or sale of any commodity, futures contract, option contract, or other transaction. Although any statements of fact have been obtained from and are based on sources that the Firm believes to be reliable, we do not guarantee their accuracy, and any such information may be incomplete or condensed.
Commodity trading involves risks, and you should fully understand those risks prior to trading. Liquidity Energy LLC and its affiliates assume no liability for the use of any information contained herein. Neither the information nor any opinion expressed shall be construed as an offer to buy or sell any futures or options on futures contracts. Information contained herein was obtained from sources believed to be reliable, but is not guaranteed as to its accuracy. Any opinions expressed herein are subject to change without notice, are that of the individual, and not necessarily the opinion of Liquidity Energy LLC
Reply