- Daily Energy Market Update
- Posts
- Daily Energy Market Update September 1,2025
Daily Energy Market Update September 1,2025
Liquidity Energy, LLC
Randall Rothenberg
September 01, 2025
In partnership with
WTI is up 68 cents RB is up 2.10 cents ULSD is up 2.77 cents
Liquidity’s Daily Market Overview
Energies are higher on the back of a weaker dollar. Also supporting prices is worries over Russian oil supply with Ukraine having launched further attacks over the weekend on Russian energy infrastructure.
Ukraine continues to target Russian energy infrastructure; it claims to have struck refineries in Krasnodar and Syzran. (ING) Russian oil flows have seen weekly shipments from its ports dropping to a four-week low of 2.72 MMBPD, according to tanker tracker data cited by ANZ analysts. (Reuters)
The dollar was close to a five-week low on Monday. The Fed is seen lowering rates this month. The latest dovish comments from two Fed policymakers added to the outlook. Fed funds futures as of Friday suggested an 89% chance the central bank will reduce rates by 25 basis points at its September 16-17 meeting, LSEG data showed. (Reuters/FXStreet)
The Baker Hughes oil rig count seen Friday showed an increase of 1 unit.
Chinese PMI data came in mixed. The official government PMI for August was 49.4. This was up slightly from July's reading of 49.3, but just below the forecast for a reading of 49.5, as per ING commentary. The private sector Caixin ( now called RatingDog) survey showed an increase to 50.5 in August from July's reading of 49.5. The forecast was for a reading of 49.7, as per Investing.com.
CFTC data seen Friday showed money managers reduced WTI net length, while adding to RB and Brent net length in the week ended Tuesday August 26. WTI net length fell by 1,978 contracts on ICE/CME combined. The total position on those 2 exchanges for WTI is -13,357 contracts in futures/options. ING notes that the net length alone on the CME fell this week to its lowest level since January 2007. RB net length rose by 11,501 contracts, primarily due to new longs. ULSD net length held by money managers rose by 693 contracts. Brent net length rose by 23,848 contracts as fresh buying came, as per ING commentary.
The CME's Globex energy platform will halt trading today between 2:30 and 6 PM EDT. All trades executed today will be for settlement Tuesday September 2.
Energy Market Technicals
The products have negative momentum basis the DC charts. WTI's DC chart momentum is looking poised to turn downward.
Despite the possibly negative DC chart momentum, WTI's spot futures price action is still showing a sideways pattern. Resistance for the spot futures lies at 65.09-65.11 and then at 65.98-66.03. Support comes in at 63.31-63.35 and then at 62.50-62.52.

RB spot futures show a large rollover gap on the DC chart as the summer grade gasoline contract for September expired Friday. The rollover gap goes all the way up to 2.1371. The now spot October contract is trading below the DC chart's lower bollinger band that intersects at 2.0135-2.0140. Chart based support lies at the overnight low at 1.9550-1.9556. Below that support is seen at 1.9361. Resistance comes in at 2.0151-2.0164 and then at the 2.05 area.

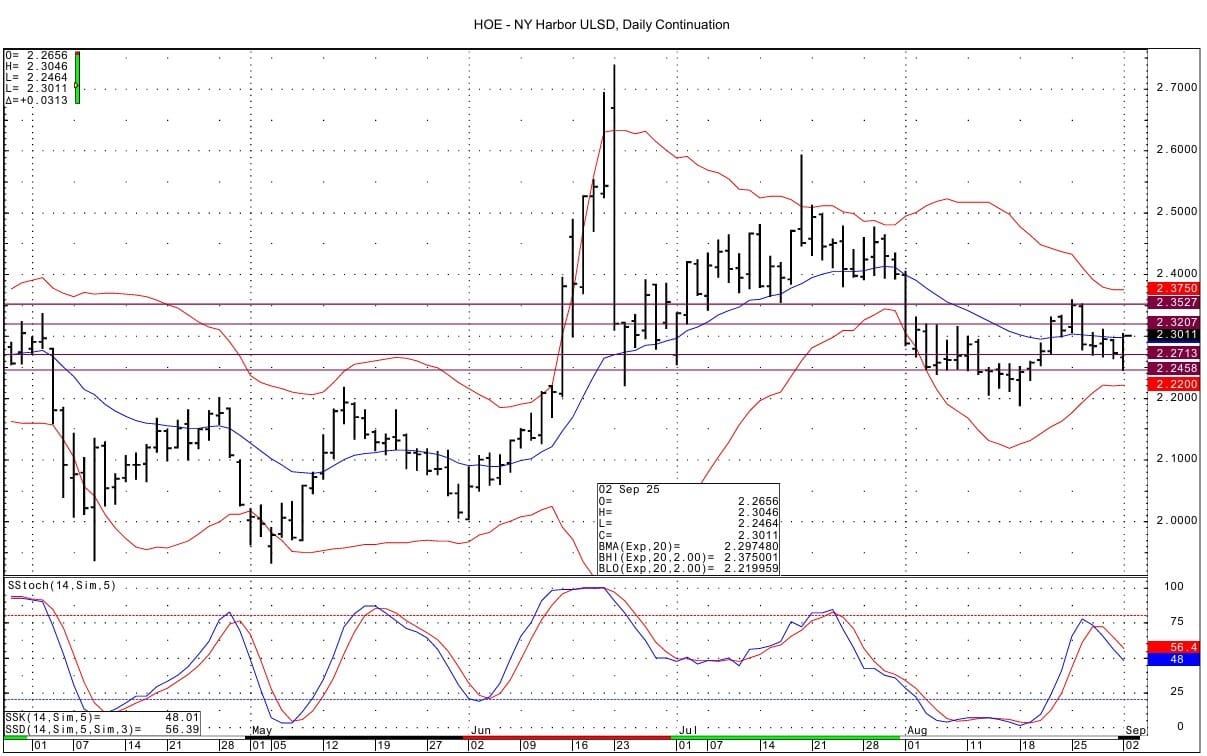
ULSD for October sees support at 2.2458-2.2472, which was tested with the overnight low of 2.2464. There is support above that at the 2.27 area. Resistance comes in at 2.3185-2.3207 and then at 2.3527-2.3554.
Natural Gas Market Overview
Natural Gas---NG is down 3.5 cents
NG futures are lower now with the market having tested over $3 again today. The market was supported by the tighter supply picture that the prior 2 weeks EIA gas storage data showed. The market is likely still skeptical though as the weather does not show excessive demand for heating or cooling.
Weather remains the key swing factor. Forecasts project early-autumn coolness across the eastern U.S., reducing late-summer air-conditioning demand, while the West braces for hotter-than-normal conditions. The NOAA continues to flag 80% probability of above-average heatwaves in the Carolinas and Virginia, implying stronger regional power burn. Some cooling demand is seen in Texas in the coming days as San Antonio is set to see highs from Tuesday thru Friday that are 8 to 10 degrees above normal. The normal high is 90 degrees.
The Baker Hughes gas rig count seen Friday showed a decrease of 3 units, with one rig having been dropped in the key Haynesville region. The lower gas rig count is supportive and underscores some of the perceived supply tightness that the past 2 week's EIA storage data implied.
CFTC data seen Friday showed money managers added to their net short position in the week ended Tuesday August 26. Net shorts rose by 7,559 to a total of 44,343 contracts.
The EIA, in its weekly gas update last week. said that the average rate of injections into storage is 18% higher than the five-year average so far in the refill season. If the rate of injections into storage matched the five-year average of 9.9 BCF/d for the remainder of the refill season, the total inventory would be 3.907 TCF on October 31, which is 154 BCF higher than the five-year average of 3,753 BCF for that time of year. This is right in line with the past week's storage data, which showed current inventories at a surplus of 154 BCF to the 5 year average.
The market has turned around technically in the past few sessions with the weekly continuation chart now having momentum that has turned positive from an oversold condition. The spot futures bounced off the lower bollinger band on the DC chart early last week and the DC chart is showing a stepladder up pattern from the past 5 sessions after making the 9 1/2 month low last Monday. Momentum basis the weekly continuation chart has turned positive from an oversold condition. As one commentary reads:" Based on current conditions, natural gas leans cautiously bullish with a Buy bias, contingent on holding above $2.92". We see support at 2.922-2.929 basis the DC chart. Below that we see support at 2.850-2.858. Resistance lies above at 3.095-3.098.


Enjoyed this article?
Subscribe to never miss an issue. Liquidity’s Daily Energy Market Updates provide a comprehensive analysis of both the fundamentals and technical factors driving energy markets.
Click below to view our other newsletters on our website:
Your Daily Edge in the Markets
Want to stay ahead of the markets without spending hours reading?
Elite Trade Club gives you the top stories, trends, and insights — all in one quick daily email.
It’s everything you need to know before the bell in under 5 minutes.
Join for free and get smarter about the markets every morning.
Disclaimer
This article and its contents are provided for informational purposes only and are not intended as an offer or solicitation for the purchase or sale of any commodity, futures contract, option contract, or other transaction. Although any statements of fact have been obtained from and are based on sources that the Firm believes to be reliable, we do not guarantee their accuracy, and any such information may be incomplete or condensed.
Commodity trading involves risks, and you should fully understand those risks prior to trading. Liquidity Energy LLC and its affiliates assume no liability for the use of any information contained herein. Neither the information nor any opinion expressed shall be construed as an offer to buy or sell any futures or options on futures contracts. Information contained herein was obtained from sources believed to be reliable, but is not guaranteed as to its accuracy. Any opinions expressed herein are subject to change without notice, are that of the individual, and not necessarily the opinion of Liquidity Energy LLC
Reply