- Daily Energy Market Update
- Posts
- Daily Energy Market Update October 9,2025
In partnership with
WTI is down 12 cents at $62.43 RB is up 0.21 cents at $1.9116 ULSD is up 0.68 cents at $2.2981
Liquidity’s Daily Market Overview
Crude prices are slightly lower today. News wire accounts cite the ceasefire agreement between Israel and Hamas for the softness in prices. Also weighing on prices is the greater than expected build in crude supplies from the DOE data. The products are up on the day as they are better supported as the DOE data seen yesterday showed strong demand.
Israel and Hamas agreed to the first phase of President Trump's peace plan for Gaza, a move that could reduce the region's risk premium. "The peace agreement is a major breakthrough in recent Middle Eastern history – its implications for oil markets could be wide-ranging, from the possibility of a decrease in the Houthis' attacks in the Red Sea to an increase in the likelihood of a nuclear deal with Iran and, eventually, the possibility for Iran to increase its crude and product exports," Rystad Energy's chief economist said in a note. Yet, an investor said that "the Gaza ceasefire was unlikely to change oil supply in the Middle East as the OPEC+ producer group has not hit its increased production targets." (WSJ/Reuters)
Crude oil supplies rose by 3.715 MMBBL in this week's DOE data as a result of strong US production and a rise in net crude oil imports. Crude production rose on the week by 124 MBPD to a strong 13.629 MMBPD ---with the Lower 48 states seeing an increase of 121 MBPD. Net crude imports rose on the week by 731 MBPD as imports rose by 570 MBPD and exports fell by 161 MBPD. These supply increases were offset somewhat by the rise in crude inputs to refineries of 129 MBPD. Product demand is up on the week with distillate demand showing a very large increase. Distillate demand rose by 729 MBPD to 4.346 MMBPD --beating last year's demand of 4.031 MMBPD and 2023 demand of 3.670 MMBPD. We believe that some of the demand increase may be about moving supplies to the retail sector as homeowners may be gearing up to fill their tanks ahead of winter. Gasoline demand rose on the week by 401 MBPD to 8.919 MMBPD--beating 2023 demand of 8.581 but lagging last year's strong demand of 9.654 MMBPD. Refinery run capacity utilization rose by 1% on the week to 92.4%. This was contrary to the estimates looking for a decline of 1.5 to 2.3%.
The strong demand seen in the DOE stats is underscored by the fact that the Total Products Supplied rose on the week to 21.990 MMBPD, which Reuters says is the most supplied since December 2022.
But, JP Morgan sees global demand having begun on a softer note in October as numerous consumption indicators, including container arrivals at the Port of Los Angeles, truck toll mileage in Germany and container throughput in China, pointed to a moderation in activity. Global oil demand averaged 105.9 MMBPD in the first seven days of October, up 300 MBPD from last year's level: but, this was 90 MBPD lower than JP Morgan's estimates, its analysts said. (Reuters)
The retail U.S. gasoline average price has fallen today to its lowest level since March 10th. The price is $3.110, which is down 4.9 cents versus a week ago and down 8.3 cents versus a month ago.
Energy Market Technicals
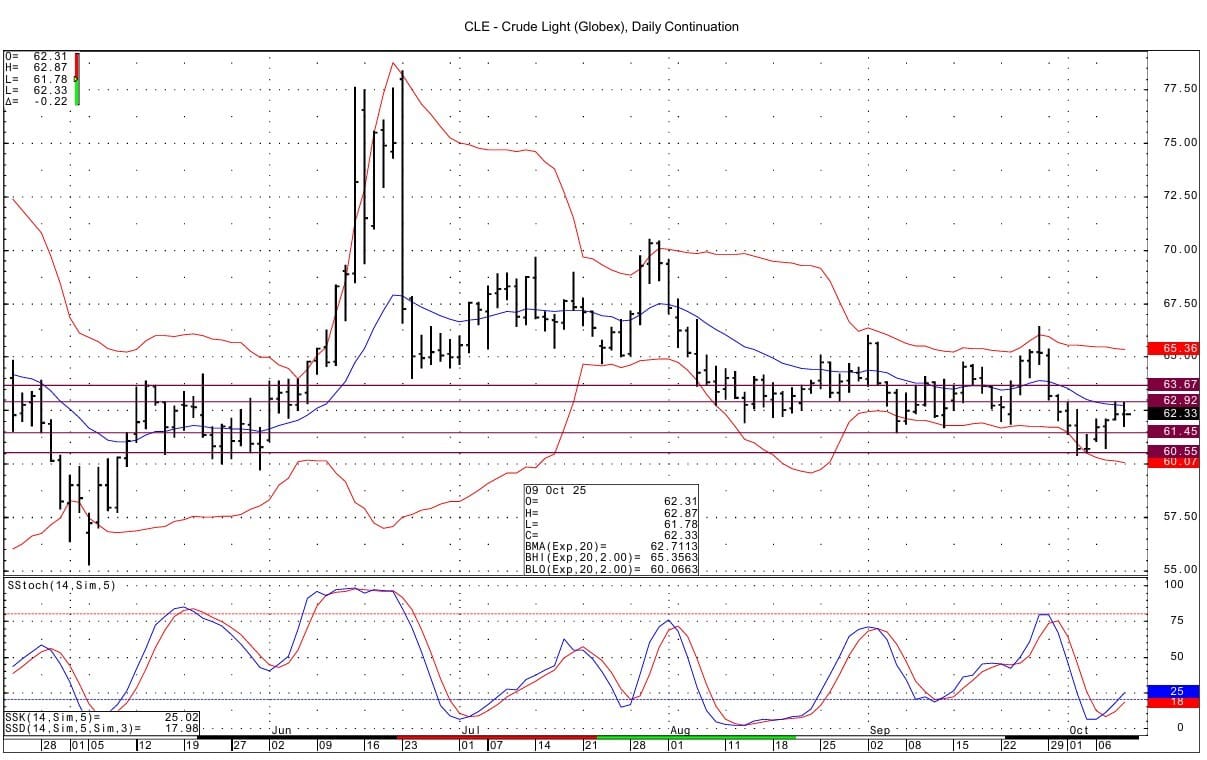
Technically momentum is positive for the energies, but at current there are double tops in the crude oil from yesterday / today.
In Brent spot futures, the double top is seen at 66.54 / 66.58. In WTI the double top is seen at 62.87 / 62.92. Above that resistance lies at 63.65-63.67. Support is seen at 61.40-61.45 and then at 60.55.
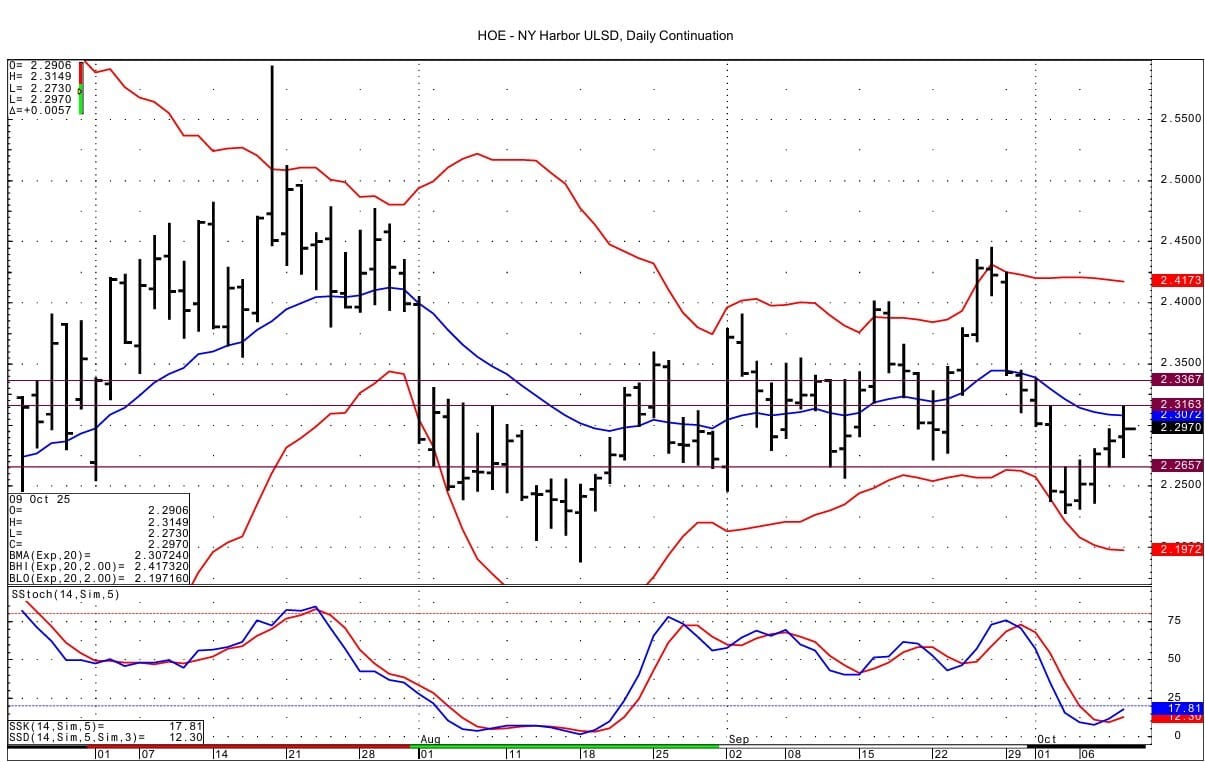
The strength in HO spot futures is evidenced by the stepladder price pattern seen from the past few sessions. Resistance is seen at the overnight high at 2.3149-2.3163 and then at 2.3367-2.3377. Support lies at 2.2644-2.2658.
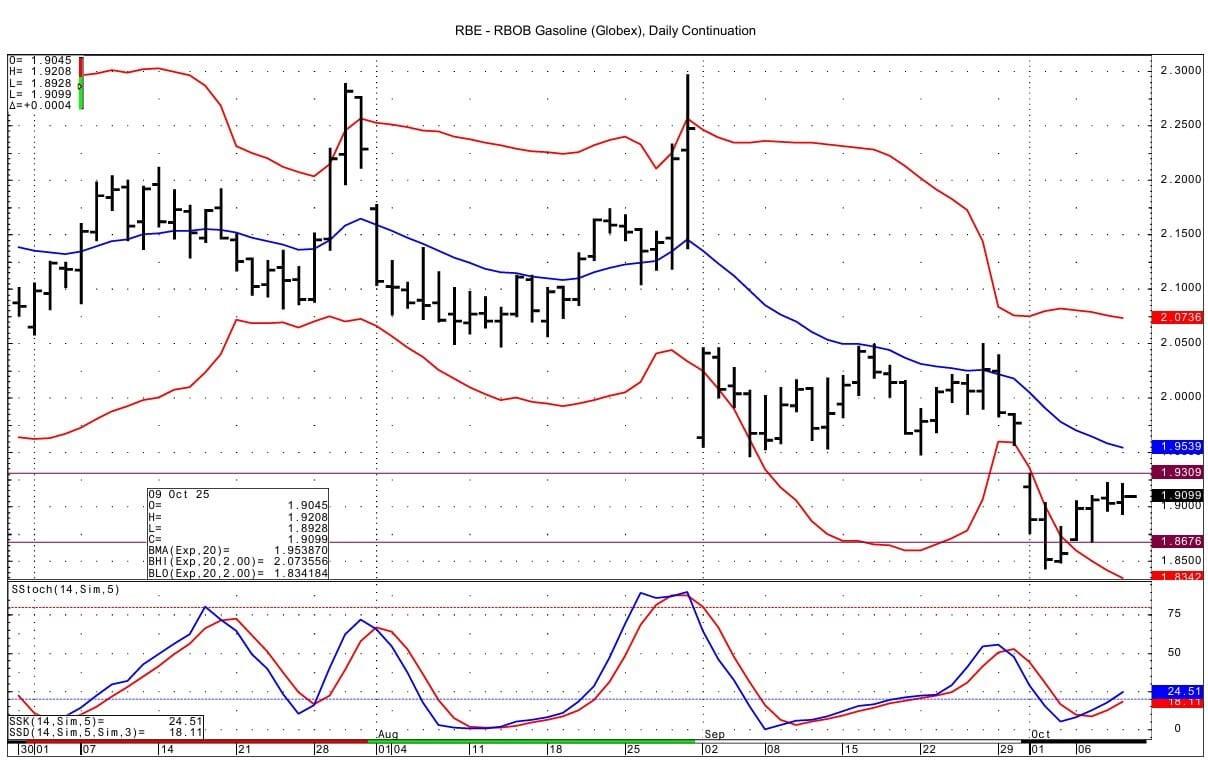
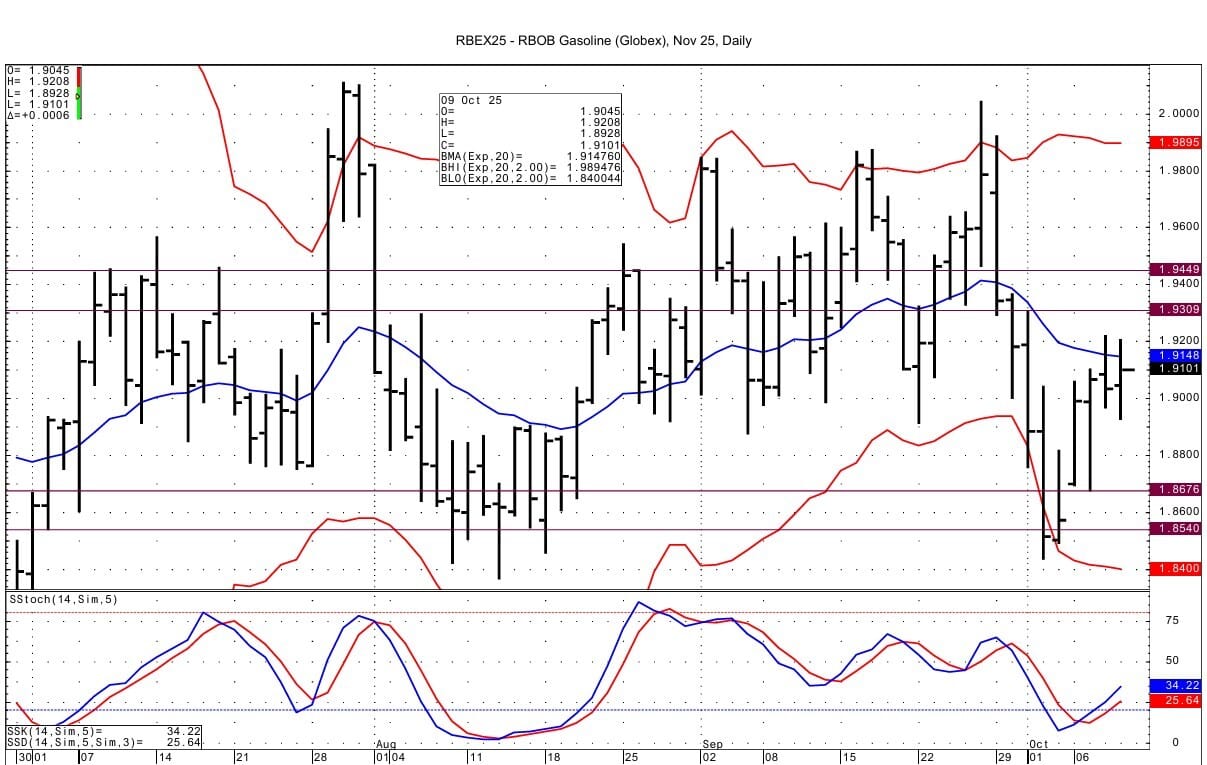
RB spot futures is seen at 1.8676-1.8693 and then at 1.8540-1.846. Resistance lies at 1.9309-1.9324 and then at 1.9445-1.9449.
Natural Gas Market Overview
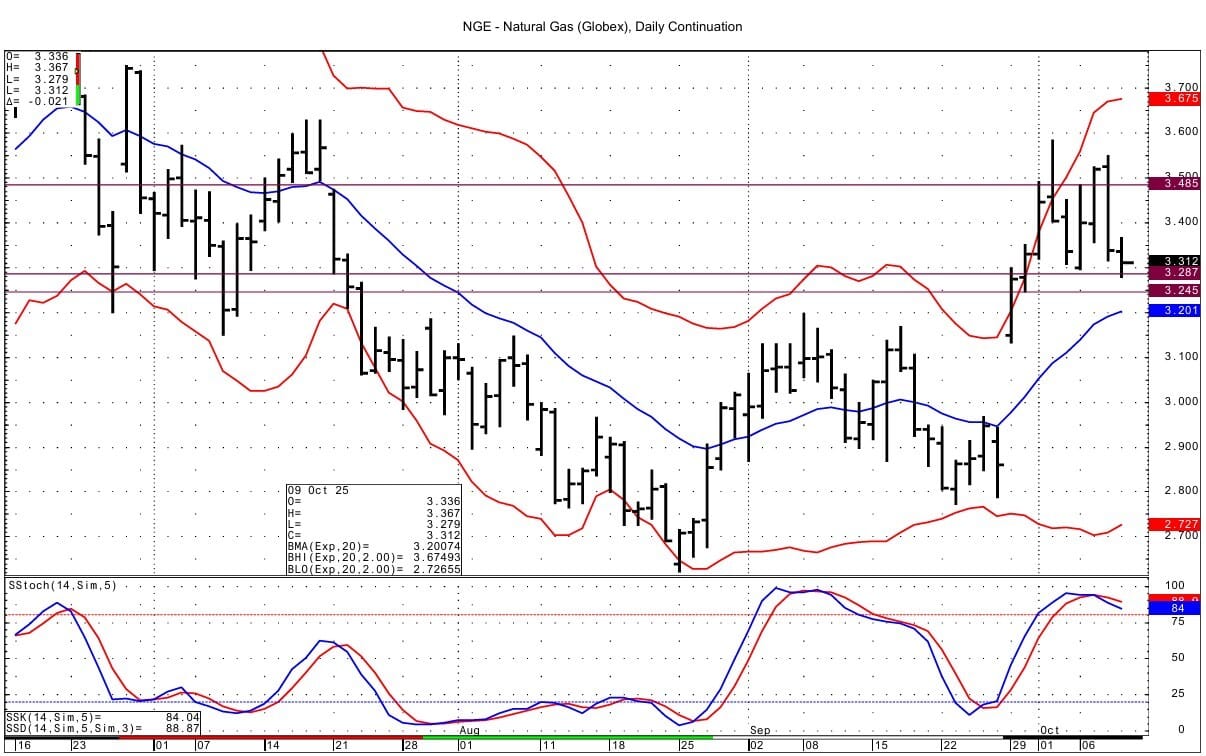
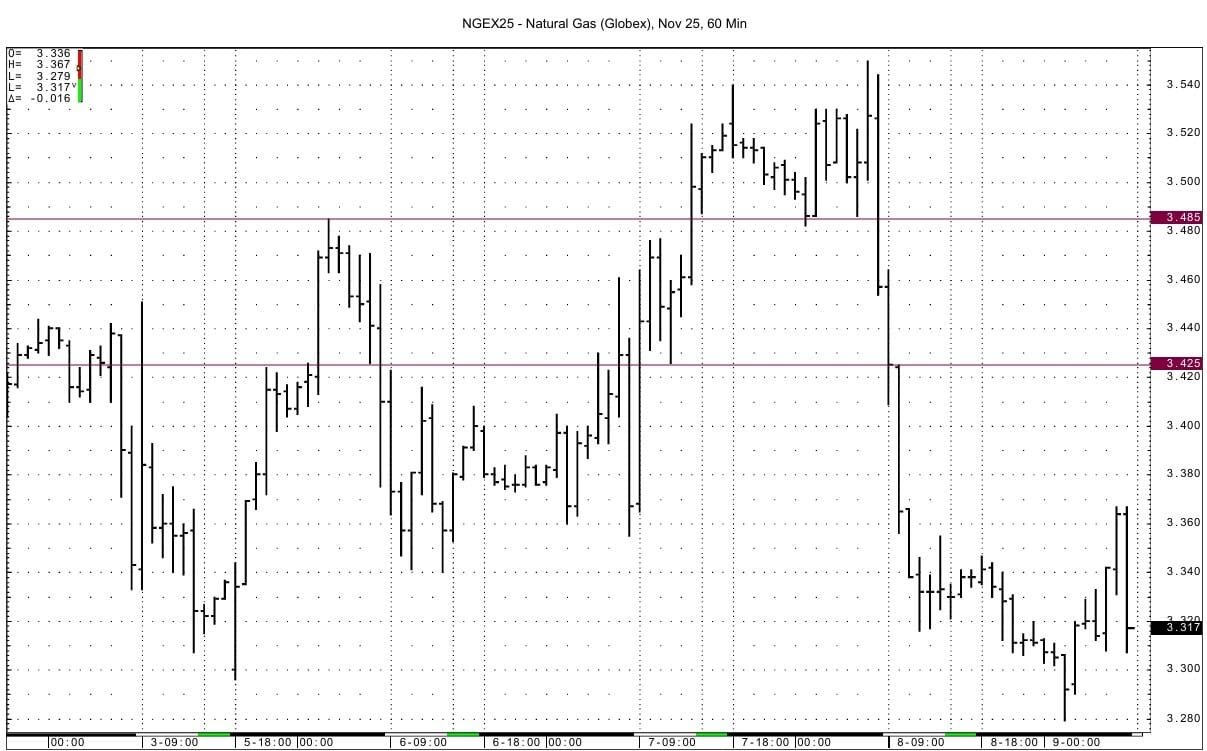
Natural Gas--NG is up 0.5 cents at $3.338
NG futures are near unchanged after Wednesday's sharp selloff. Mid-October temperature forecasts trending warmer and profit taking from an overbought technical condition were seen behind the drop in NG prices Wednesday.
The EIA gas storage data due out today is seen as a build of 75 to 77 BCF, as per the WSJ, Reuters & Bloomberg surveys. This compares to last year's build of 78 BCF and the 5 year average build of 94 BCF.
Bloomberg data was revised to where Tuesday's dry natural gas production numbers were raised to 107.13 BCF/d from 105.89 BCF/d, which is now about 1 BCF/d below the 30-day moving average of 108.16 BCF/d. Production today is estimated at 108.0 BCF/d. This compares to the 30 day average of 108.15 BCF/d.
TTF European gas futures prices have gapped lower today as WSJ commentary cites less supply concerns for the drop. Qatar Energy has been authorized to continue shipments of LNG through the Persian Gulf after the country’s transportation ministry had suspended maritime activity earlier in the week. (NGI) One source quoted by the WSJ suggests that despite storage being below the 5 year average, the target levels set by the EU are seen being reached before the start of heating season. Storage is currently at 83%. The 5 year average is 91%. The EU target is 90% by November 1, although the deadline is now flexible between October 1st and December 1st. The TTF spot futures gap currently lies from Euro 32.380 to 32.510.
Technically NG futures show us that prices over $3.55 are not sustainable. Some resistance is likely below that at 3.485-3.490. Support at 3.287-3.293 was tested overnight with a low of 3.279. Below that support lies at 3.238 / 3.245. Momentum turned negative with the steep selloff seen yesterday.
Enjoyed this article?
Subscribe to never miss an issue. Liquidity’s Daily Energy Market Updates provide a comprehensive analysis of both the fundamentals and technical factors driving energy markets.
Learn AI in 5 minutes a day

This is the easiest way for a busy person wanting to learn AI in as little time as possible:
Sign up for The Rundown AI newsletter
They send you 5-minute email updates on the latest AI news and how to use it
You learn how to become 2x more productive by leveraging AI
Click below to view our other newsletters on our website:
Disclaimer
This article and its contents are provided for informational purposes only and are not intended as an offer or solicitation for the purchase or sale of any commodity, futures contract, option contract, or other transaction. Although any statements of fact have been obtained from and are based on sources that the Firm believes to be reliable, we do not guarantee their accuracy, and any such information may be incomplete or condensed.
Commodity trading involves risks, and you should fully understand those risks prior to trading. Liquidity Energy LLC and its affiliates assume no liability for the use of any information contained herein. Neither the information nor any opinion expressed shall be construed as an offer to buy or sell any futures or options on futures contracts. Information contained herein was obtained from sources believed to be reliable, but is not guaranteed as to its accuracy. Any opinions expressed herein are subject to change without notice, are that of the individual, and not necessarily the opinion of Liquidity Energy LLC
Reply