- Daily Energy Market Update
- Posts
- Daily Energy Market Update October 3,2025
WTI is up 27 cents at $60.75 RB is up 1.48 cents at $1.8658 ULSD is down 0.60 cents at $2.2375
Liquidity’s Daily Market Overview
Despite being higher this morning, WTI is on track for a weekly drop in prices of 7.6%, their steepest weekly decline since late June, as per Reuters reporting. All eyes will be on the OPEC+ meeting to be held this weekend, with worries over a very large increase in production having largely led to this week's weakness.
Reuters commentary reads as follows: " Potentially higher OPEC+ supply, slowing global crude refinery runs due to maintenance and a seasonal dip in demand in the months ahead are set to accelerate oil stock builds in the U.S. and elsewhere, analysts say." One analyst adds: “Concerns that a US government shutdown will curtail economic activity and the resumption of Iraq’s Kurdish oil exports is also weighing on the crude price.”
The eight members of OPEC+ could agree to raise production in November by 274 to 411 MBPD, or two or three times higher than the October increase, sources told Reuters on Tuesday, as Saudi Arabia seeks to reclaim market share.
LSEG Oil Research is estimating that China's crude imports dropped to around 10.83 MMBPD from 11.65 MMBPD in August, the lowest since February. This may be a function of the fact that oil prices rose in June amid the Iran/Israel conflict and that September deliveries to China would have been purchased in June, Reuters adds.
A Reuters survey shows that OPEC raised its oil output in September by 330 MBPD to 28.40 MMBPD. Under an agreement by eight OPEC+ members covering September output, the five of them that are OPEC members - Algeria, Iraq, Kuwait, Saudi Arabia and the UAE - were to raise output by 415 MBPD before the effect of compensation cuts totaling 170 MBPD for Iraq, Kuwait and the UAE. According to the survey, the actual increase by the five was 347 MBPD.
Citigroup sees further losses in crude prices during the final quarter of 2025. "As we enter 4Q’25, we expect OPEC+ exports to rise as Mideast summer crude burn wanes seasonally, while the broader oil balance surplus could begin to show up more visibly in key hubs too,” Citi added. Citibank revised its 0-3mth point price view to $60 a barrel for Brent, and $57 a barrel for WTI, consistent with its $60 average Brent forecast for the first quarter of 2026. The bank had a prior 0-3 month price view for Brent of $65. (investing.com)
The Commitment of Traders report normally issued Fridays by the CFTC will not be published today due to the US government shutdown.
Energy Market Technicals
Momentum remains negative for the energies.
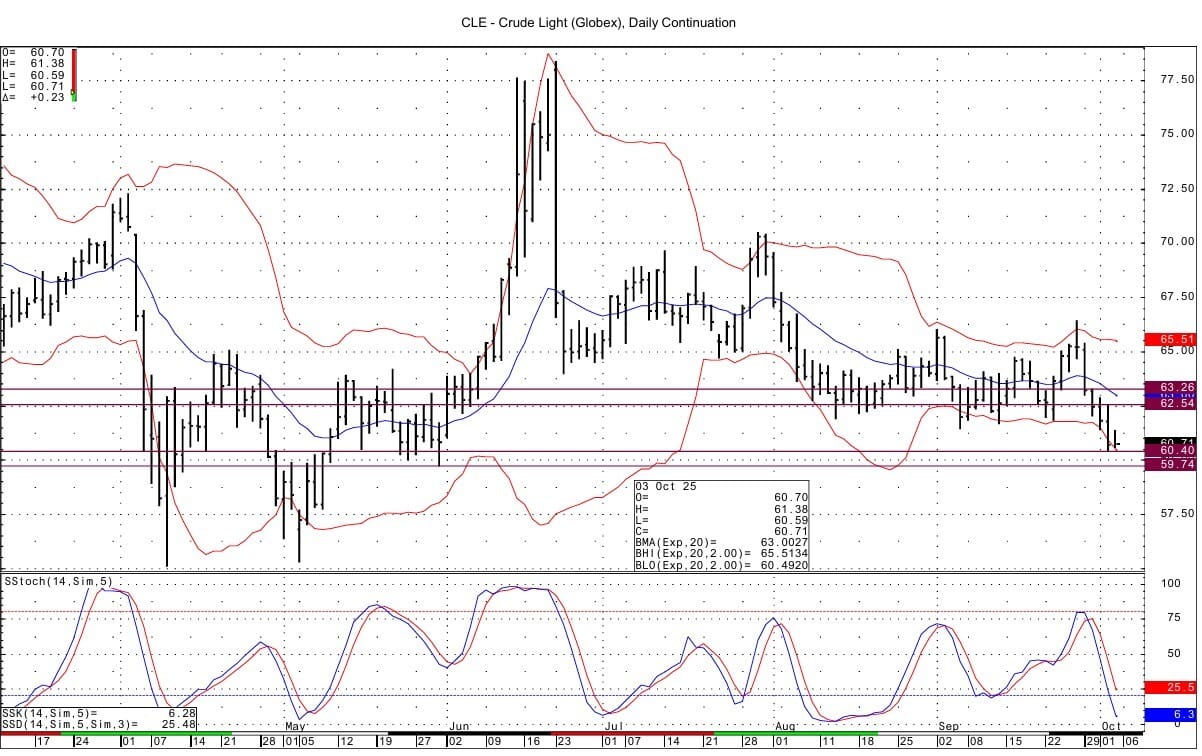
Technically WTI spot futures have a mean reversion setup with Thursday's close under the lower bollinger band on the DC chart. That band lies at 60.49. Support basis the DC chart lies just below that at yesterday's low at 60.40-60.47. Below that support lies at 59.74. Resistance comes in at 62.52-62.58 and then at 63.18-63.26.
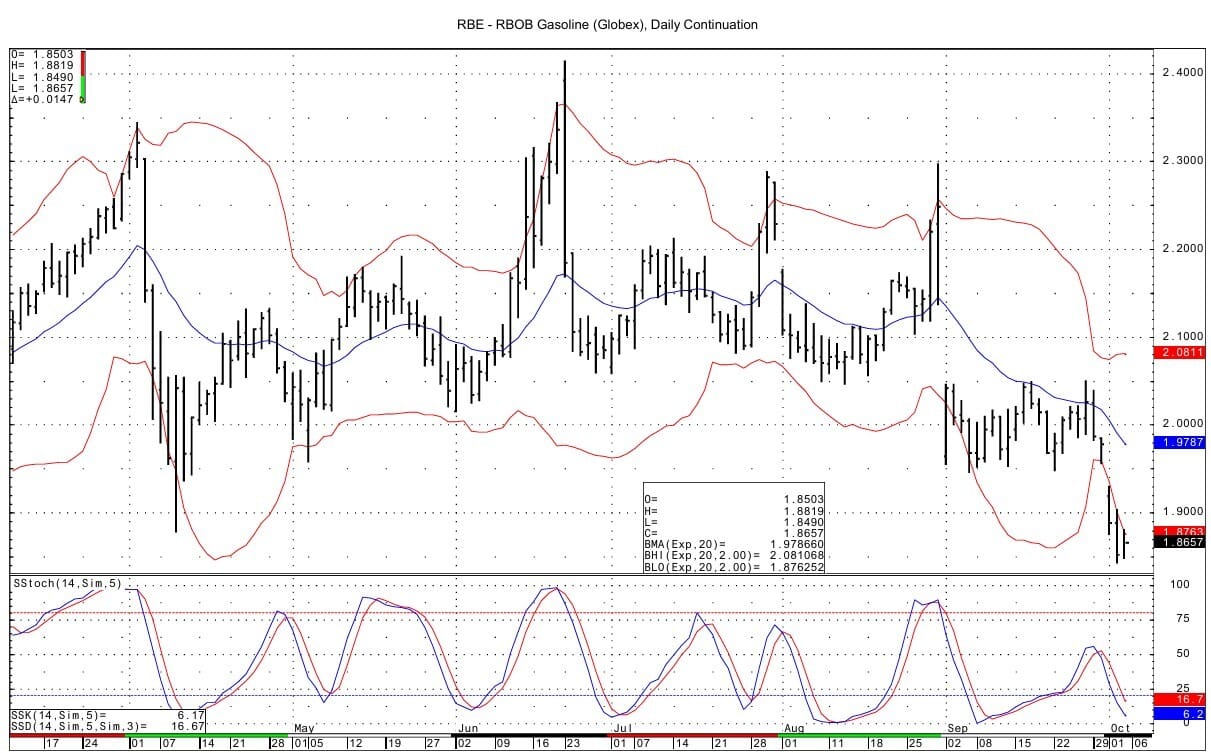
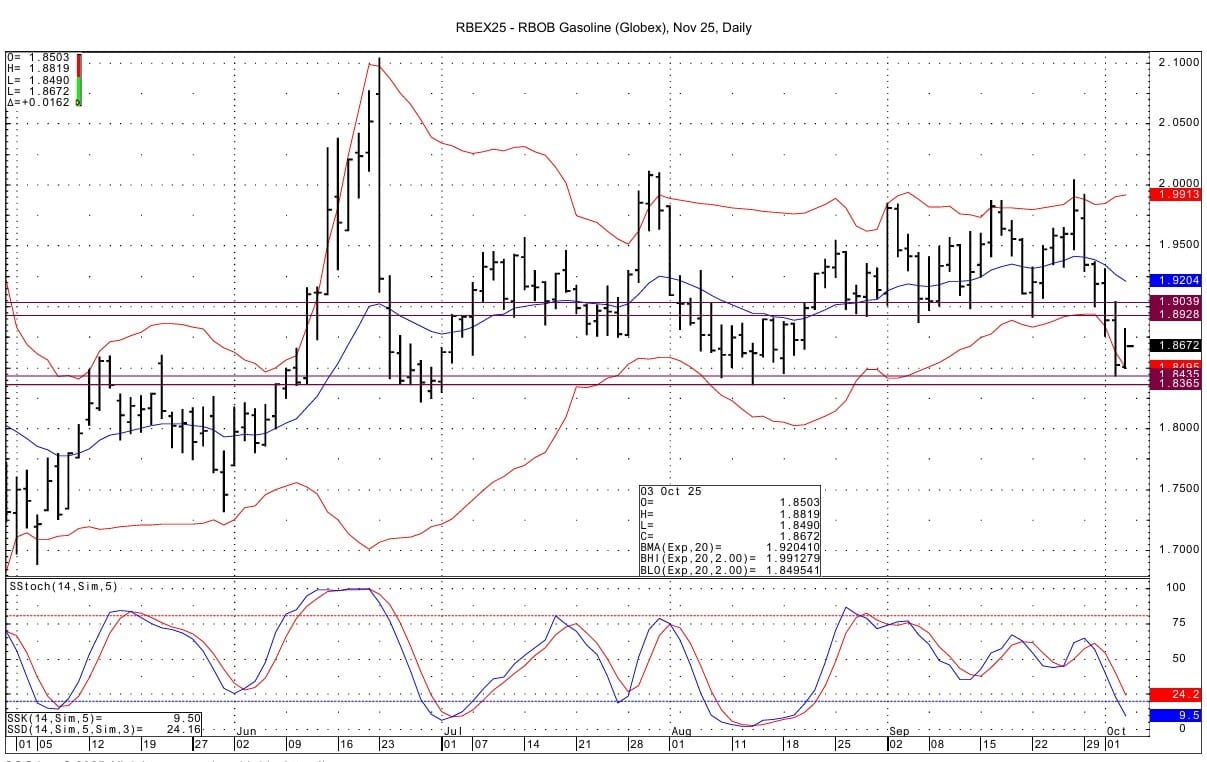
RB spot futures see support at 1.8420-1.8435 and then at 1.8355-1.8370. Resistance lies at 1.8928-1.8938 and then at 1.9039-1.9043. The DC chart lower bollinger band lies at 1.8763.
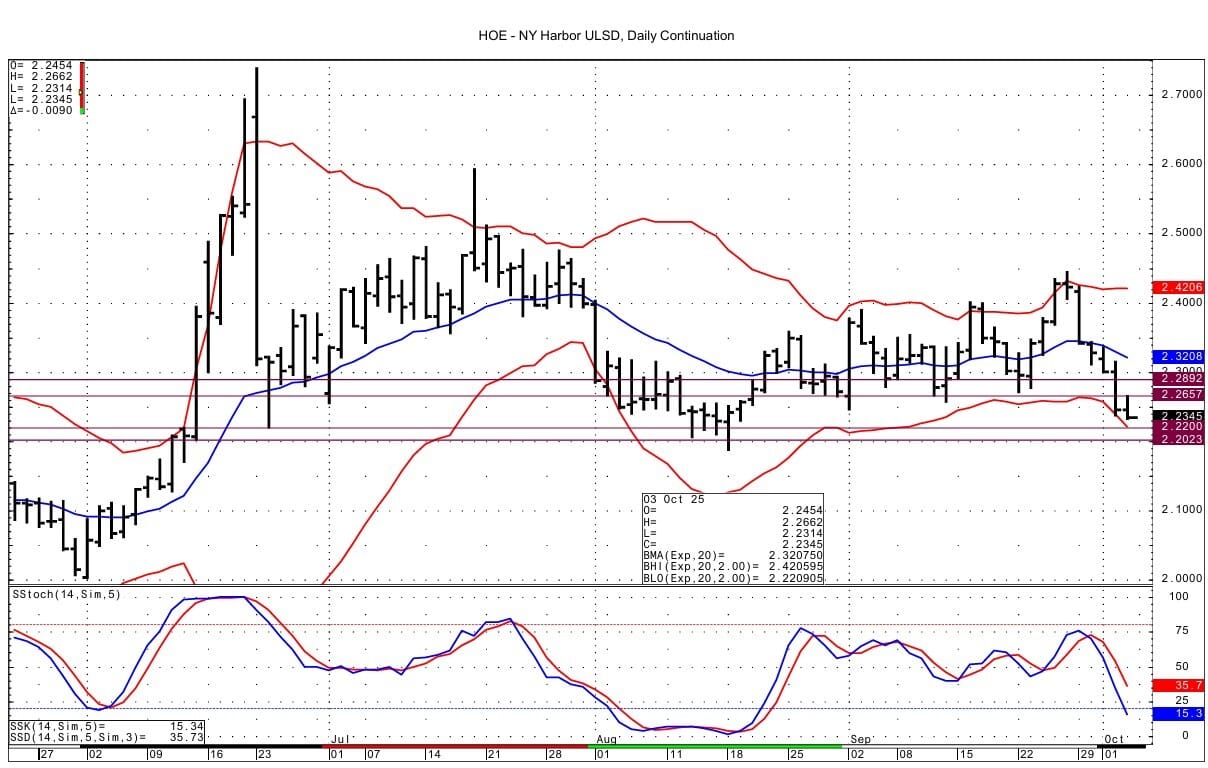
ULSD spot futures support comes in at 2.2200 and then at 2.2023-2.2057. The DC chart's lower bollinger band intersecting at 2.2210 lies above the supports we see Resistance is seen at today's high at 2.2644-2.2662 and then at 2.2892-2.2899.
Natural Gas Market Overview
Natural Gas- NG is down 9.9 cents at $3.343
Natural gas spot futures are lower again today as the weather does not suggest excessive heating demand. Also, profit taking/long liquidation was cited for the pullback seen Thursday. The pullback came despite a bullish EIA storage number.
“A comfortable pattern is expected over most of the US for the 10-15 day period,” NatGasWeather.com says in a report. Forecaster Atmospheric G2 said Thursday that after a brief cool spell, temperatures are expected to rise above normal in the middle of the US for October 12-16.
The EIA storage data came in under estimates. The build was 53 BCF, versus most estimates for a build of 64 to 68 BCF. Total storage rose to 3.561 TCF. This is +21 BCF/+0.59 % versus last year and +171 BCF/+5.04% versus the 5 year average. One commentary cited lower wind generation and a pickup in LNG export demand for the bullish EIA report.
Goldman Sachs has kept its forecast for Henry Hub gas prices unchanged, with November–December delivery contracts seen at $4.00 and 2026 prices seen at $4.60, the bank said in a note on Thursday. “We believe we are quickly approaching a period when the market’s focus will more sustainably shift towards 2026 tightness concerns,” the bank noted.
In NG futures' settlements Thursday, despite the bullish EIA number, the November spot futures settled lower, while the contracts in the rest of the winter strip from December to March settled higher--suggesting to us less concern over immediate supply versus the rest of the winter with LNG demand ramping up in some facilities in the coming months and the impending winter --versus the current sufficient gas in storage--evidenced by the still slight surplus that we have versus last year's storage level.
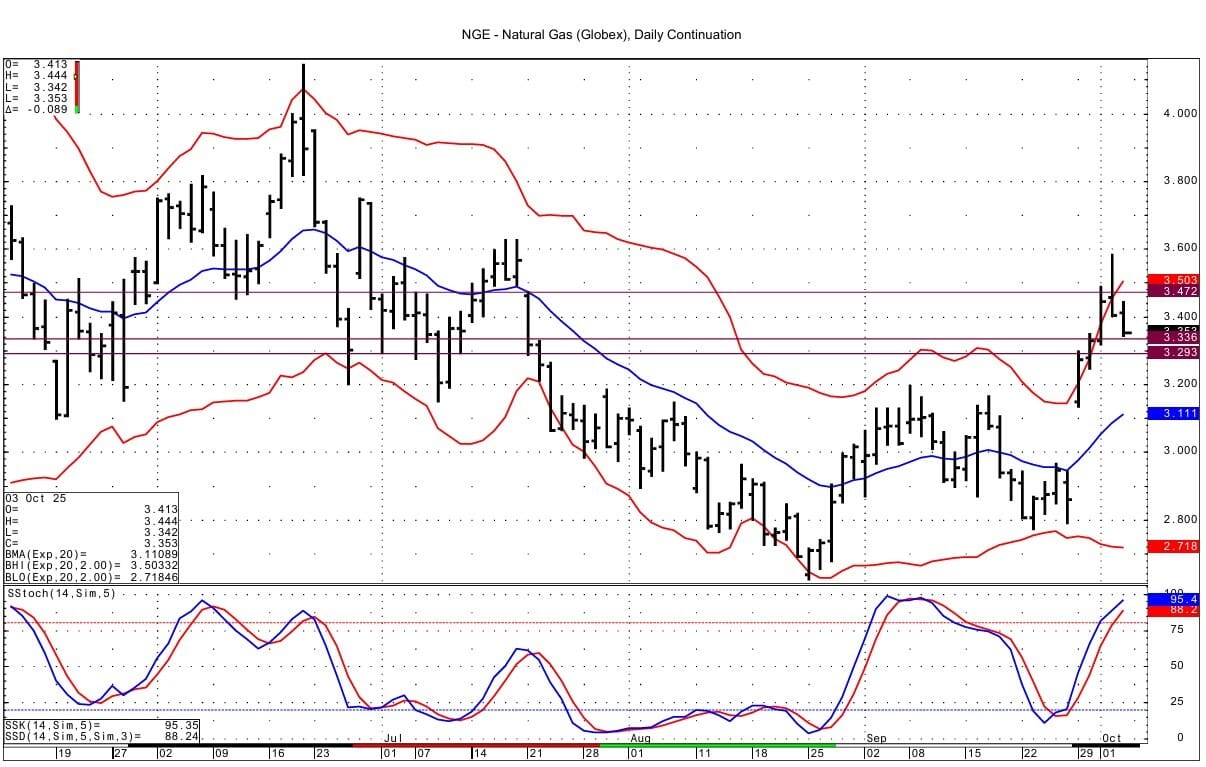
Technically, the mean reversion setup from Wednesday's close above the upper bollinger band on the DC chart was confirmed with Thursday's close back below the band. The band today lies at 3.503. Momentum is still positive and not quite overbought yet. Resistance above lies at 3.469-3.475. Support at 3.335-3.336 has been tested this morning with a low of 3.333. Below that support is seen at 3.293.
Enjoyed this article?
Subscribe to never miss an issue. Liquidity’s Daily Energy Market Updates provide a comprehensive analysis of both the fundamentals and technical factors driving energy markets.
Click below to view our other newsletters on our website:
Disclaimer
This article and its contents are provided for informational purposes only and are not intended as an offer or solicitation for the purchase or sale of any commodity, futures contract, option contract, or other transaction. Although any statements of fact have been obtained from and are based on sources that the Firm believes to be reliable, we do not guarantee their accuracy, and any such information may be incomplete or condensed.
Commodity trading involves risks, and you should fully understand those risks prior to trading. Liquidity Energy LLC and its affiliates assume no liability for the use of any information contained herein. Neither the information nor any opinion expressed shall be construed as an offer to buy or sell any futures or options on futures contracts. Information contained herein was obtained from sources believed to be reliable, but is not guaranteed as to its accuracy. Any opinions expressed herein are subject to change without notice, are that of the individual, and not necessarily the opinion of Liquidity Energy LLC
Reply