- Daily Energy Market Update
- Posts
- Daily Energy Market Update October 1,2025
Daily Energy Market Update October 1,2025
Liquidity Energy, LLC
December 30, 2025
WTI is down 43 cents at $61.94 RB is down 2.17 cents at 1.9006 ULSD is down 0.46 cents at $2.3195
Liquidity’s Daily Market Overview
Energies are lower at current -having traded either side of unchanged overnight. Disappointing PMI data from many countries around the world and disappointing US jobs data are weighing on prices, while on the positive side, the API data showed a surprising draw in crude supplies. But, overall there is still a negative tinge due to the possibility of further OPEC+ crude oil production increases.
OPEC wrote in a post on X on Tuesday that media reports of plans to raise output by 500 MBPD were misleading. Yet, two of three sources told Reuters, that eight members of OPEC+ could agree to raise production in November by 274-411 MBPD, or two or three times higher than the October increase. Reuters added that Saudi Arabia is seen pushing to regain market share. "This (OPEC+) strategy could significantly squeeze margins for high-cost U.S. shale producers, potentially forcing them to scale back the record-level output they’ve maintained,", said one analyst.
API Forecast Actual
Crude Oil +0.2/+1.0 -3.674
Gasoline Unch/+0.7 +1.3
Distillate -0.5/-1.1 +3.003
Cushing n/av -0.693
Runs -0.3/-1.0% n/av
Factory activity shrank in much of the world last month, private surveys showed on Wednesday, as signs of a slowdown in U.S. growth and the anticipated impact of President Trump's tariffs added to pressure from weak Chinese demand. Euro zone manufacturing slipped back into contraction as new orders fell at their fastest rate in six months, with export markets acting as a particular drag. The Euro zone PMI for September fell to 49.8 from August's reading of 50.7, which was then the first reading over 50 since mid-2022. The bloc's three largest economies - Germany, France and Italy - all registered contractions in September data. In Britain, outside the European Union, activity shrank at the fastest pace in five months, reflecting subdued domestic demand and fewer export orders. Export powerhouse Japan and global tech hub Taiwan saw manufacturing activity shrink in September. The S&P Global Japan Manufacturing PMI fell to 48.5 in September from 49.7 in August, staying below the 50.0 threshold. It shrank at the fastest pace in six months due to steep falls in output and new orders, the survey showed. (Reuters)
Yet, the official Chinese PMI for September was somewhat positive as it was the strongest since March, even though it still suggests contraction in the economy at a reading of 49.6. September's reading was the 6th straight month of contraction. The reading beat the Reuters forecast of 49.4. There were notable gains in both output and new orders. Private surveyor RatingDog, with data compiled from S& P Global, also released its manufacturing PMI, with the reading at 51.2 for September, beating economists’ forecast for 50.2 in a Reuters poll, marking its highest level since May. The Ratingdog survey used to be the Caixin survey. (CNBC)
Today, ADP data showed that September's U.S. private employment fell by 32,000 jobs versus a Bloomberg estimate of an increase of 51,000 jobs. The ADP release shows the biggest private payrolls drop since March 2023 and before that, June 2020. And the prior 54,000 addition to jobs that was seen in August was revised down to minus 3,000 jobs, so that is the first back-to-back set of drops in jobs since the pandemic.
Gasoil stocks in the Amsterdam-Rotterdam-Antwerp (ARA) region continue to recover, hitting their highest level since May. Recent data shows a surge in these inventories, with a 13% increase in September compared to August due to a significant rise in gasoil imports from the UK and other sources, despite ongoing strong demand from inland locations like Germany, which has been impacted by persistently low Rhine water levels. Russia’s diesel export ban for resellers should have a limited impact on flows. (ING)
Mexican crude oil exports rebounded in September as higher volumes to Europe offset a decline in shipments to Asia, according to Bloomberg. Ships loaded 624 MBPD in September, up 10% on the month but down 12% on the year. Flows to the U.S. rose 2.8% on the month to 394 MBPD.
Three sizable trades were seen traded in crude oil options Tuesday on the CME. These were in a 4th quarter WTI put spread, December WTI calls and an April Brent futures style margin option. The 4th quarter WTI $61/$57 put spread traded in a 1 by 2 ratio at a cost of 29 cents. The October option portion of the 4th quarter put spread will expire at the end of October. The December WTI $80/$85 call spread traded in a 1 by 2 ratio, with the $80 call sold against two $85 calls bought at a cost of 10 cents. In the Brent futures style margin, the April $55/$50 put spread traded at a cost of 71 cents with .07 delta futures bought at $65.30. A Brent Futures-style margin option is an options contract that does not require the option's premium (cost) to be paid upfront; instead, it is settled daily through a "mark-to-market" system where variation margin is paid or received based on the option's changing value.
A survey compiled by The Wall Street Journal--which includes projections from Goldman Sachs, JPMorgan and Morgan Stanley--showed Brent crude is expected to average $63.56 a barrel in the fourth quarter, while West Texas Intermediate is seen at $60.36 a barrel. That is in line with last month's projections of $63.57 and $60.30. In the Journal's survey, Brent and WTI are forecast to fall to $61.77 a barrel and $58.74 a barrel, respectively, in the first quarter of 2026. These estimates are down from last month's projections of $62.73 and $59.65 respectively. Major banks see more upside later in the year, with prices averaging $63.07 and $61.83, respectively, in the fourth quarter.
Energy Market Technicals
Momentum remains negative for the energies.
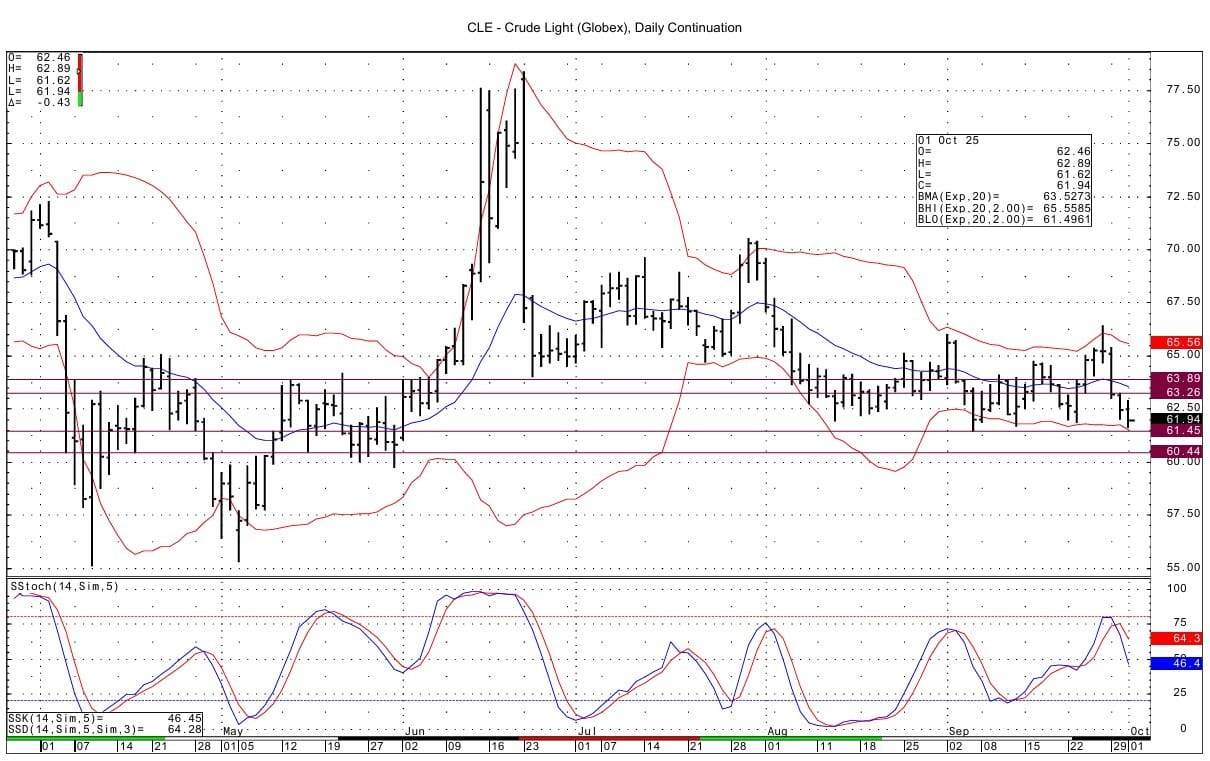
The WTI overnight low of 61.62 came close to the key low/support of 61.45 from early September. Below this support is seen at 60.44-60.47. Resistance comes in at 63.24-63.26 and then at 63.88-63.90.

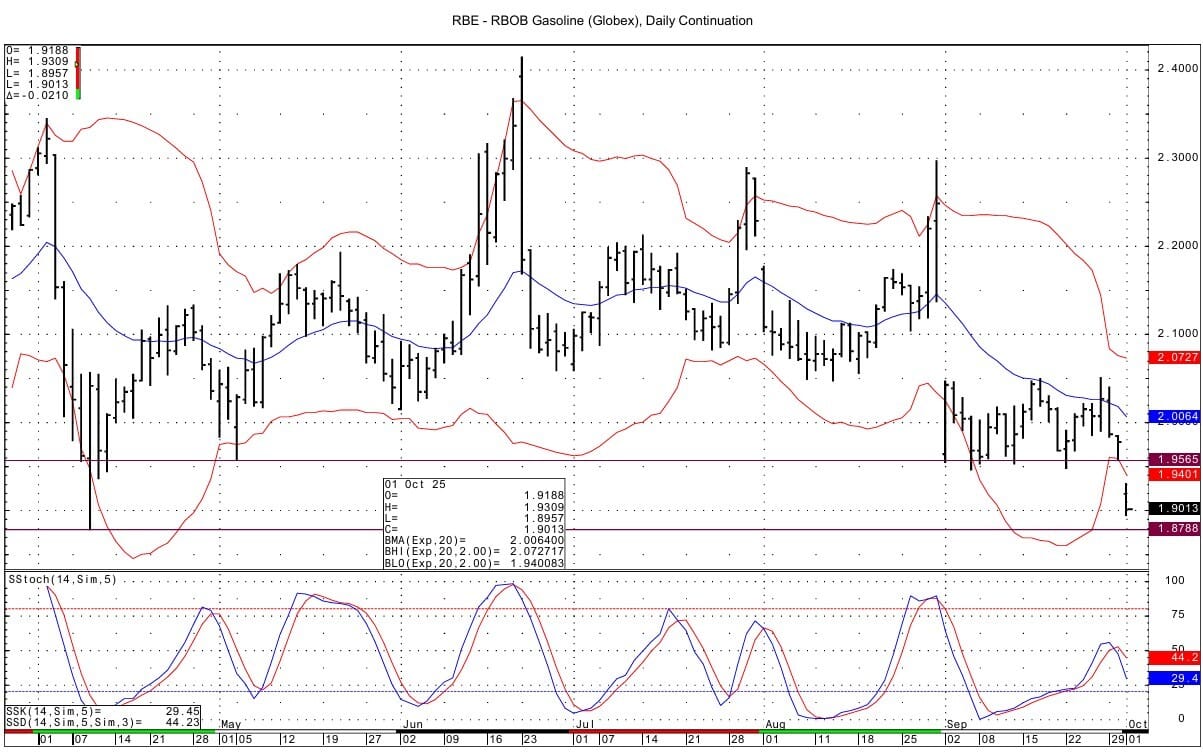
The RB spot futures chart has a large rollover gap from the October contract's expiration. The gap goes to 1.9565. Resistance lies below that at 1.9353-1.9368 and then at 1.9445-1.9449 from November daily chart data. Support comes in at the major DC chart low at 1.8788 and then at 1.8752-1.8768 from major support seen on the November daily chart.The Nov. RB contract is currently trading below the DC chart's lower bollinger band. That band intersects at 1.9393.


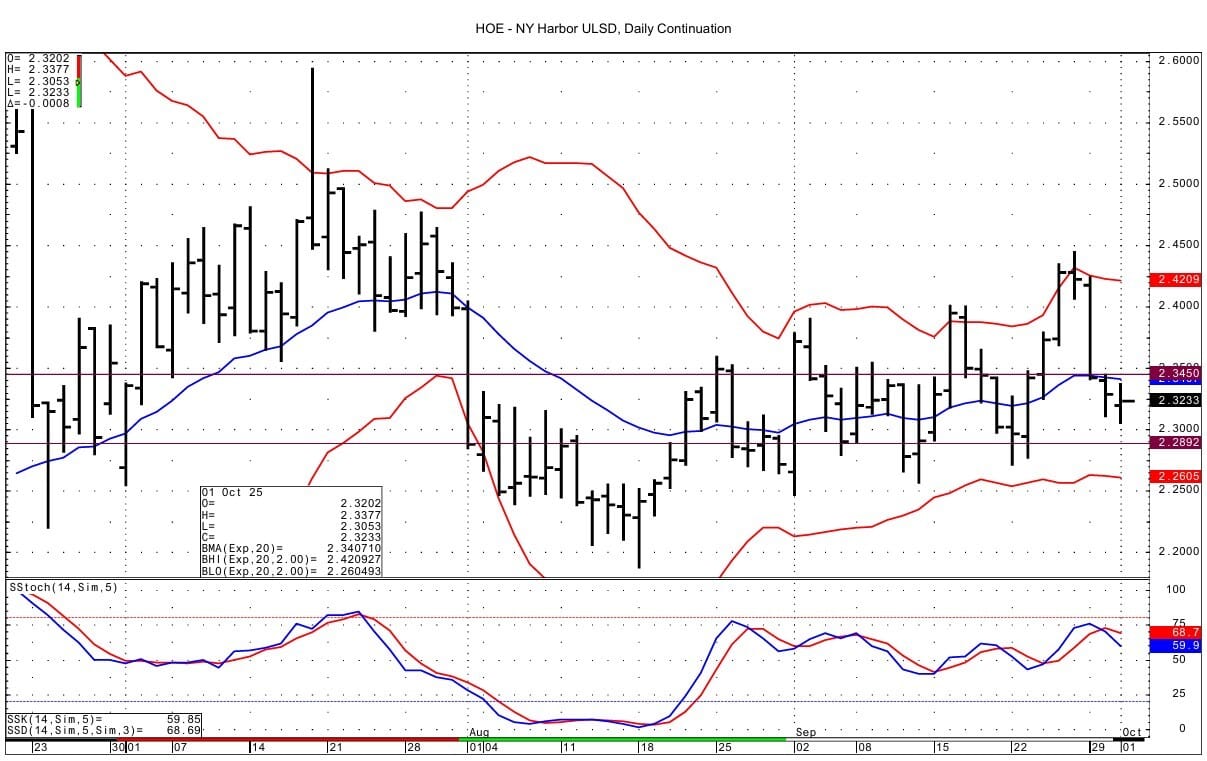
ULSD spot futures support is seen at the 2.29 area and resistance at 2.3450-2.3477.

Natural Gas Market Overview
Natural Gas--NG is up 7.8 cents at 3.381
NG futures are higher with commentaries offering different reasons for the strength. One cites strong LNG export demand, while another cites a dip in gas production this week. Another cites strength in cash pricing. We wonder if some of the rally is about perceived winter strength and hence long positioning, given the recent increase in open interest in NG futures.
Celsius Energy said Tuesday that LNG export demand came in at 16.15 BCF/d, up +5.0 BCF/d versus last year. This is the largest year-over-year gain since July & essentially cancels out the year-over-year gain in production.
U.S. domestic natural gas production is estimated down to 107.5 BCF/d today compared to just over 109 BCF/d at the start of the week, according to Bloomberg data. Production averaged 108.8 BCF/d over the previous week.
Next day Henry Hub cash was seen at 3.130-3.150 yesterday mid-morning. This was up 20 cents from Monday's pricing. The cash futures differential narrowed Tuesday to 15 cents, down from the 34- 36 cent differential seen in the prior session.
The NG futures open interest rose strongly again in Tuesday's CME data. We suspect that again new length was added in the winter strip. Open interest rose by over 15,000 contracts, as it did on Monday.
We wish to add the notion that some of the rally seen this week could be related to OPEC+'s possible production increase and the possible attempt by the Saudis to regain market share. If the Saudis succeed at crowding out the U.S. producers and as a result U.S. oil production declines, then associated natural gas production would likely fall, thus supporting NG prices to some extent.
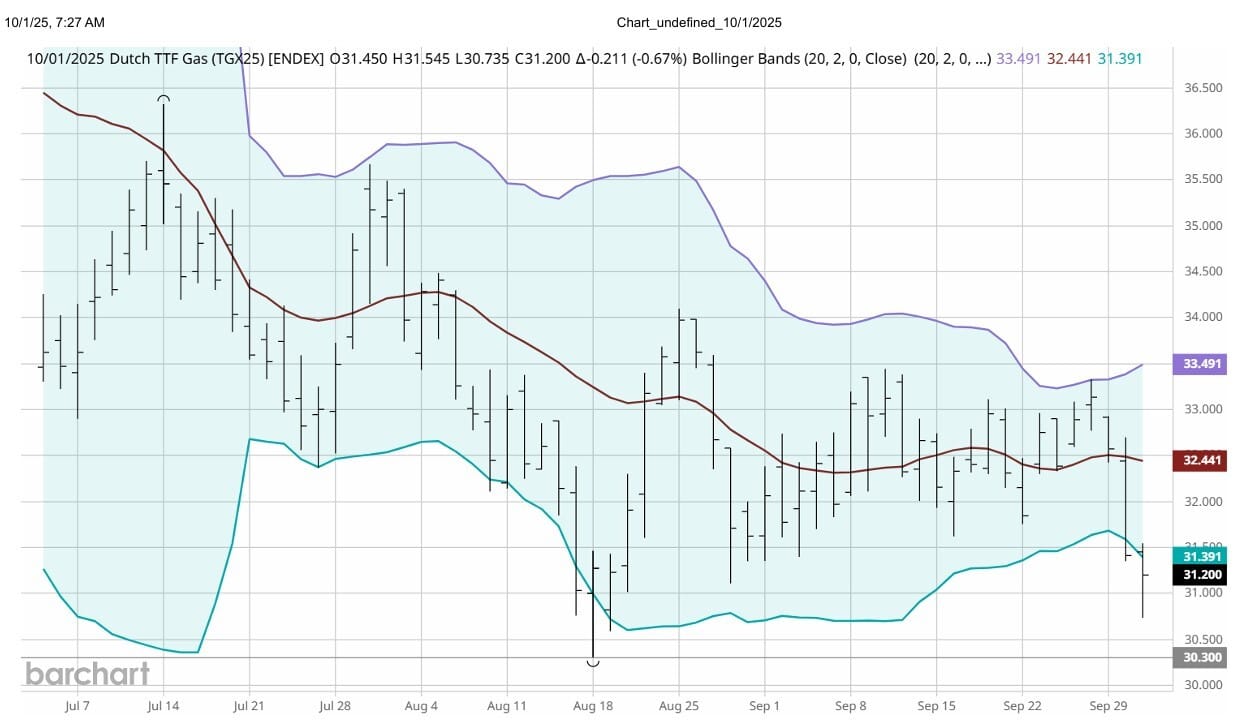
The TTF spot natural gas futures have fallen today to their lowest value in 6 weeks as strong storage injections ease winter concerns. Inventories in France and Italy stand above 90%. Lower LNG demand in Asia, due to milder cooling needs, has freed up supplies for Europe, supporting the price drop. (Trading Economics) The low for the November spot TTF futures today is Euro 30.735. This is near to the low seen August 18 of Euro 30.300. The one supportive element for the TTF futures today is the fact that the contract is testing the DC chart's lower bollinger band, which intersects at 31.391.

In the LN/NG options on Tuesday, the October 2026 $2.60/$2.25 put spread traded in a 1 by 2 ratio with the $2.60 put being sold and the $2.25 bought for a net cost of 0.5 cents. The trade was initiated given the open interest increases seen in those strikes in CME data. The April/October 6 month CSO 50 cent put traded 10.2 cents in an initiating trade. The April October futures spread settled Tuesday at 43.9 cents. The contract low for the spread is 49.6 cents. The November $3.00 put open interest rose by nearly 5,000 contracts. Among trades seen in that strike was a purchase of the November $3.00 put with .24 delta futures bought at $3.31.
Momentum remains positive, as the spot futures almost tested resistance at 3.398-3.401 with an overnight high of 3.396. Resistance above that comes in at 3.469-3.475. Support is seen at 3.287-3.293 and then at 3.245. The one drawback is that the spot futures continue to bump up against the DC chart's upper bollinger band. That band lies at 3.352.

Enjoyed this article?
Subscribe to never miss an issue. Liquidity’s Daily Energy Market Updates provide a comprehensive analysis of both the fundamentals and technical factors driving energy markets.
Click below to view our other newsletters on our website:

Disclaimer
This article and its contents are provided for informational purposes only and are not intended as an offer or solicitation for the purchase or sale of any commodity, futures contract, option contract, or other transaction. Although any statements of fact have been obtained from and are based on sources that the Firm believes to be reliable, we do not guarantee their accuracy, and any such information may be incomplete or condensed.
Commodity trading involves risks, and you should fully understand those risks prior to trading. Liquidity Energy LLC and its affiliates assume no liability for the use of any information contained herein. Neither the information nor any opinion expressed shall be construed as an offer to buy or sell any futures or options on futures contracts. Information contained herein was obtained from sources believed to be reliable, but is not guaranteed as to its accuracy. Any opinions expressed herein are subject to change without notice, are that of the individual, and not necessarily the opinion of Liquidity Energy LLC
Reply