- Daily Energy Market Update
- Posts
- Daily Energy Market Update November 20,2025
Daily Energy Market Update November 20,2025
Liquidity Energy, LLC
Randall Rothenberg
November 20, 2025
July 25, 2026
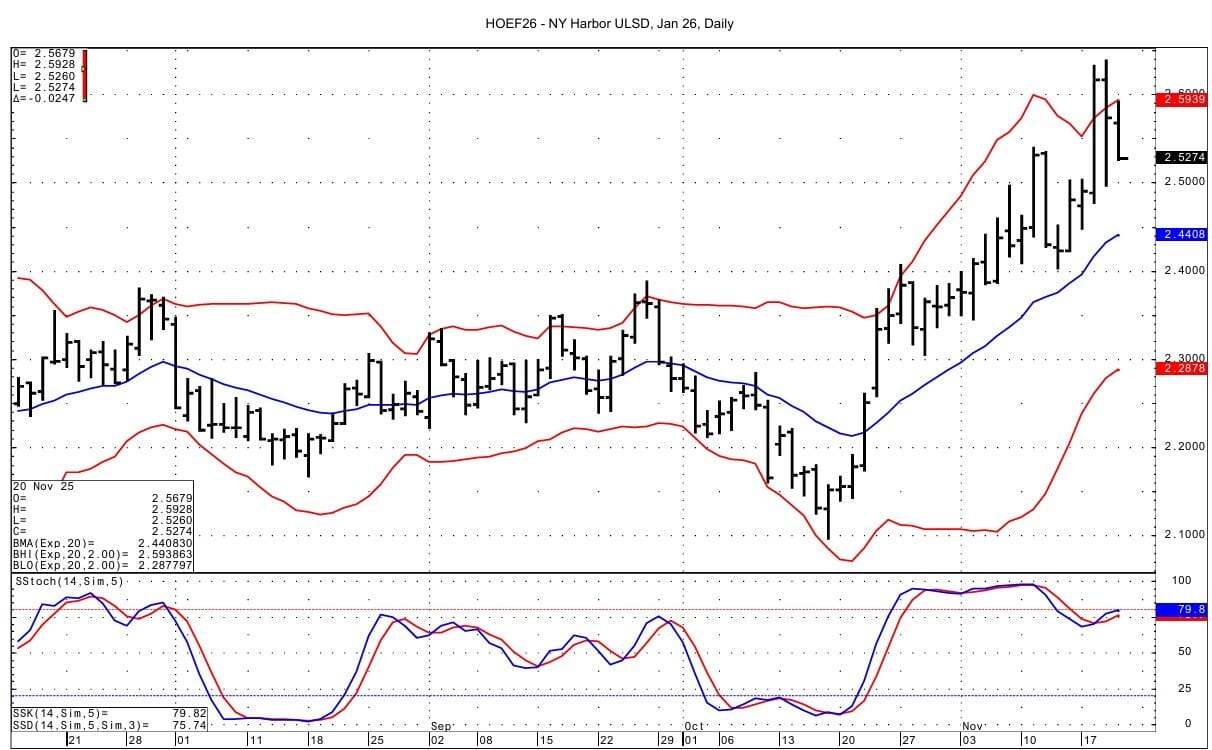
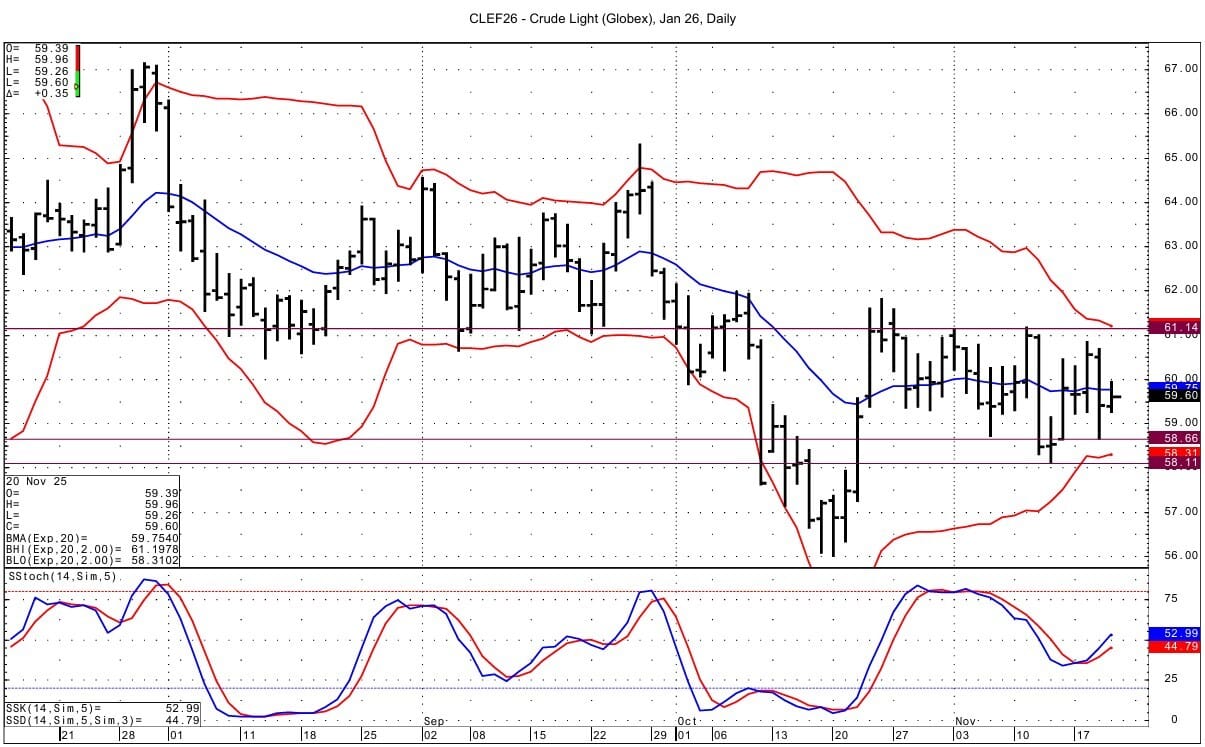
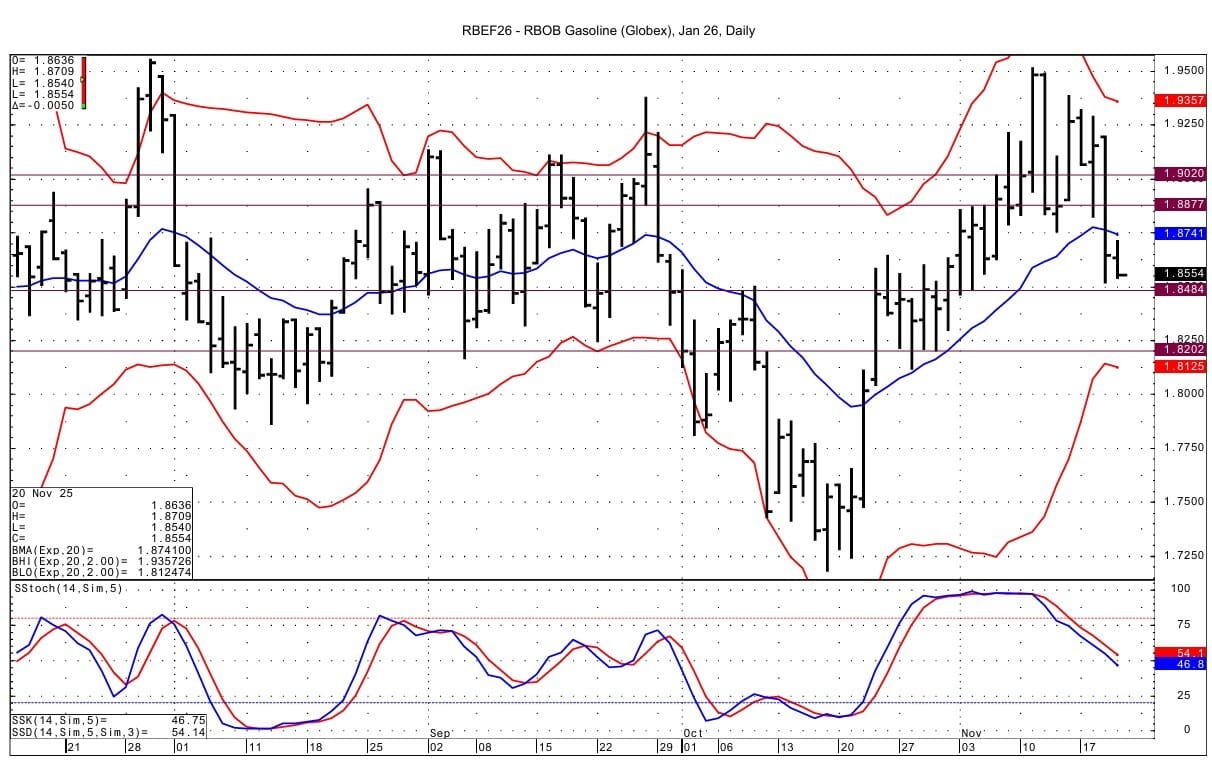
January WTI is up 48 cents at $59.73 January RB is down 0.28 cents at $1.8576 January ULSD is down 3.12 cents at $2.5209
Liquidity’s Daily Market Overview
Energies are mixed -with crude oil higher, RB down slightly, but ULSD quite a bit lower. Crude oil is supported by a risk on mentality after good Nvidia earnings and by the draw in crude oil supplies seen in the DOE data. Some support for crude oil may also be coming from tomorrow's deadline for sanctions to begin against Rosneft and Lukoil. A strong US dollar is seen as a slight headwind for oil prices.
Contributing to the weakness in energies Wednesday was a report that the US has renewed efforts at a peace deal in the Ukraine war. A framework could be agreed by all parties by the end of the month, a senior White House official told Politico, and possibly as soon as this week. However, given failed previous attempts, a deal still seems a long way off. The U.S. has signaled to Ukraine's President that his side must accept the U.S.-drafted framework to end the war, which proposes Kyiv giving up territory and some weapons, two sources told Reuters. ING comments that "with suggestions that the plan is favorable towards Russia, it may be unlikely that Ukraine will back it. Signs that the US is still trying to work on a deal eases some concerns over further sanctions against Russia and also how strongly current curbs will be enforced."
Russia's Deputy Prime Minister Novak denied that the US sanctions were impacting Russia's oil production, and said Russia will reach its OPEC+ production quota by the end of this year or early next year. (Reuters)
The DOE data issued Wednesday was supportive for crude oil with a draw in inventories of 3.426 MMBBL, beating expectations and reversing the build of 4.45 MMBBL seen in the API data this week. The drop in crude supplies seen this week was mostly a function of an increase in exports of 1.342 MMBPD, which thus saw net crude imports fall by 614 MBPD. Also contributing to the crude supply draw was the increase in inputs to refineries of 259 MBPD. This raised crude inputs to refineries to 16.232 MMBPD, which is 4 MBPD more than the amount seen 1 year ago. Most of the refinery run increase was seen in the Midwest region, where a prior issue at the very large BP Whiting, Indiana refinery had curtailed operations. Gasoline supplies rose by 2.327 MMBBL. A draw was forecast. Gasoline demand fell by 500 MBPD to 8.528 MMBPD. Yet, this week's demand figure still beat that seen in the prior 2 years by 48 to 109 MBPD. Distillate supplies rose by 0.171 MMBBL; here, too, a draw was expected. Distillate demand fell on the week by 136 MBPD to 3.882 MMBPD, beating last year's demand of 3.775 MMBPD, but lagging 2023 demand of 4.110 MMBPD.
The US Non Farm Payroll jobs data for September issued today showed 119,000 new jobs added. This was better than the forecast for 50,000 new jobs to have been added. But, revisions to July and August jobs data saw a decrease of 33,000 jobs from prior data. August's revision saw the economy lost 4,000 jobs versus the prior data of 22,000 jobs having been added.
Today is the last trading day for the December WTI futures.
Energy Market Technicals
Crude oil continues to trade in a sideways pattern--even as momentum points upward. The energies are currently having inside trading days versus yesterday's price ranges. Momentum for RB is negative, while that for ULSD is positive given the sharp rally seen in the prior sessions.
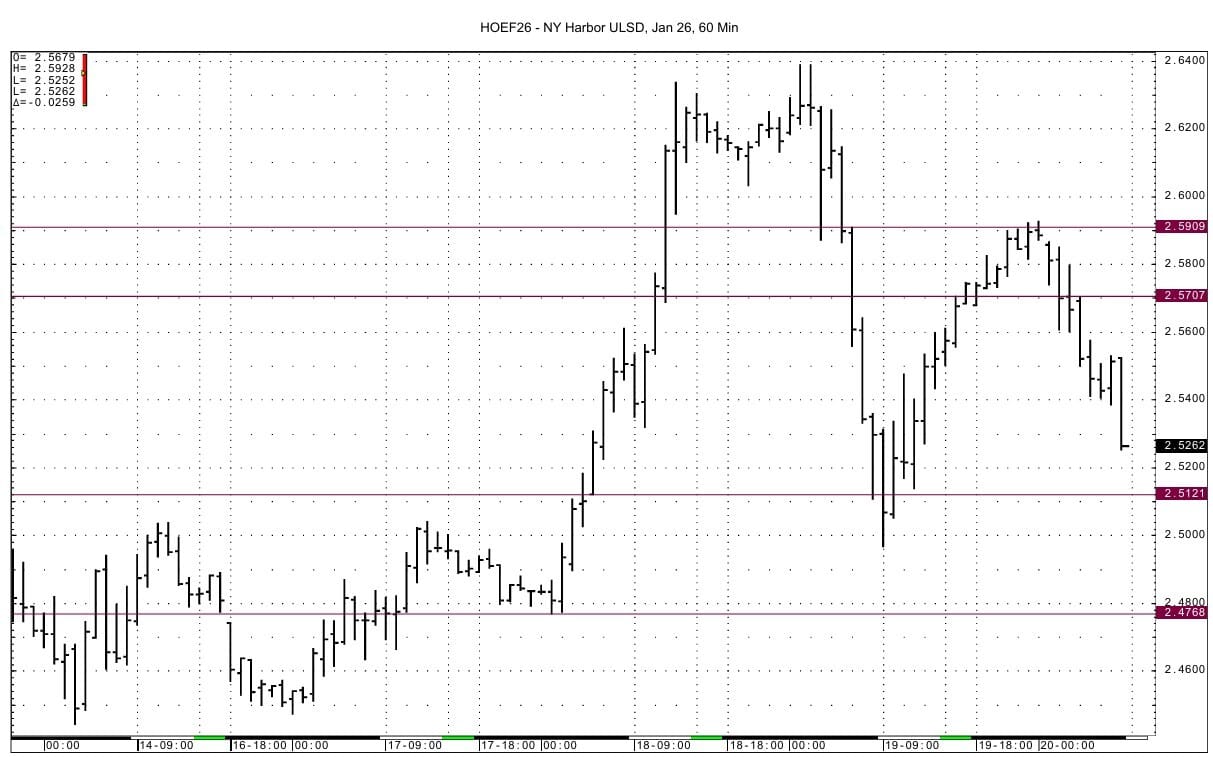
On Wednesday, January ULSD confirmed the mean reversion setup from the day before--having closed back below the upper bollinger band on the daily chart. Resistance comes in at 2.5705-2.5707 and then at 2.5909-2.5928, which is the overnight high. The highs from the prior 2 sessions are well above at over 2.63. Support lies at 2.5108-2.5121 and then at 2.4768-2.4774. Our supports and resistances are from the January 60 minute chart.
WTI for January sees support at 58.66-58.71 and then at the recent low at 58.11. Resistance lies at 60.79-60.85 and then at 61.14-61.18.
January RB support lies at 1.8464-1.8484 and then at 1.8202-1.8212. Resistance comes in at 1.8870-1.8877 and then at 1.9000-1.9010.
Natural Gas Market Overview
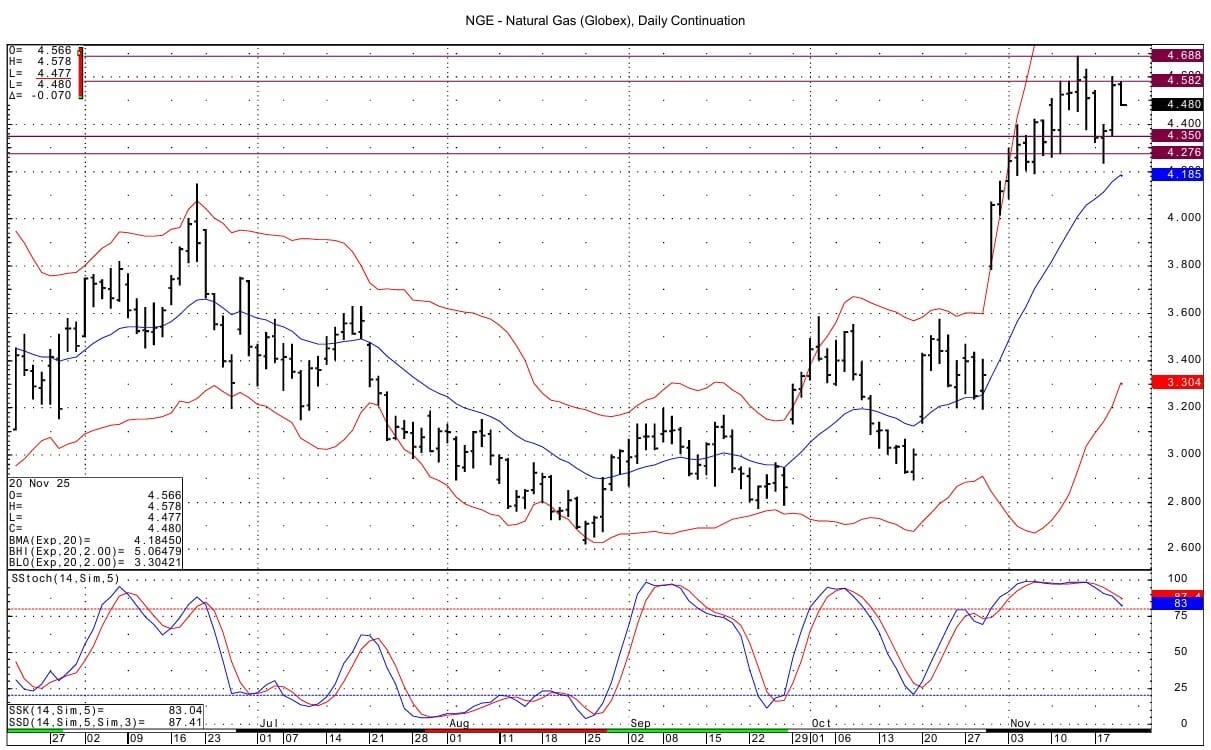
Natural Gas---December NG is down 4.4 cents at $4.506
NG futures are down as the market pauses for now --awaiting today's EIA storage report that is expected to show the first withdrawal of the season. The market rose quite a bit yesterday on the back of a colder early December forecast. Strong LNG export demand is also seen having supported prices Wednesday. The question is whether the market is going to try to test the high for the spot futures of 4.688 seen 1 week ago--or whether cash prices behind futures by over 60 cents and ample inventories will hold the contract back.
The EIA storage data is seen as a draw of 13-14 BCF, as per WSJ and Reuters surveys. Last year saw a build of 3 BCF and the 5 year average build for the week is 12 BCF.
NG futures were helped Wednesday by the possibility for a cold snap in mid to late December, based on a BNEF model showing the right conditions for a polar vortex. The GFS and ECMWF forecasts both point to below-average temperatures through December. Forecaster Atmospheric G2 said Wednesday that temperatures shifted colder in the eastern two-thirds of the US later in the November 24-28 period, and forecasts shifted colder in the middle third of the country for November 29-December 3.
LSEG on Wednesday said that November so far has seen US gas production at a rate of 109.1 BCF/d, which is down from Monday's level of 109.3 BCF/d. US domestic natural gas production is estimated to be down 0.166 BCF/d today to 110.14 BCF/d compared to the 30 day average of 110.25 BCF/d, according to BNEF.
Feedgas demand in November has run at a rate of 18.0 BCF/d, up from Monday's rate of 17.9 BCF/d. LNG terminal feedgas is estimated to be down by 0. 150 BCF/d today at 17.94 BCF/d compared to an average of 17.77 BCF/d so far this month.
LSEG forecasts natural gas demand for this week at 116.6 BCF/d and sees the same rate for next week. These forecasts are up a total of 0.3 BCF/d from those seen Monday.
Notable options trades from Wednesday on the CME include the March $7/$10 call spread that traded 4.4 cents in an initiating trade as per open interest data. The January February calendar call spread (CSO) 50 cent/ $1.00 traded; the 50 cent call was sold against buying of twice as many of the $1.00 calls for a cost of 1.2 cents. The March April CSO $1.00 call traded 6.0 cents in what looks to be a closing of a position basis CME open interest data. The February March CSO 25 cent/10 cent put spread traded in 2 different large trades. One trade saw the 25 cent put bought against selling of 2 of the 10 cent puts for a cost of 4.3 cents. The 25/10 cent put spread also traded in a 1 for 1 ration at a cost of 5.3 cents.
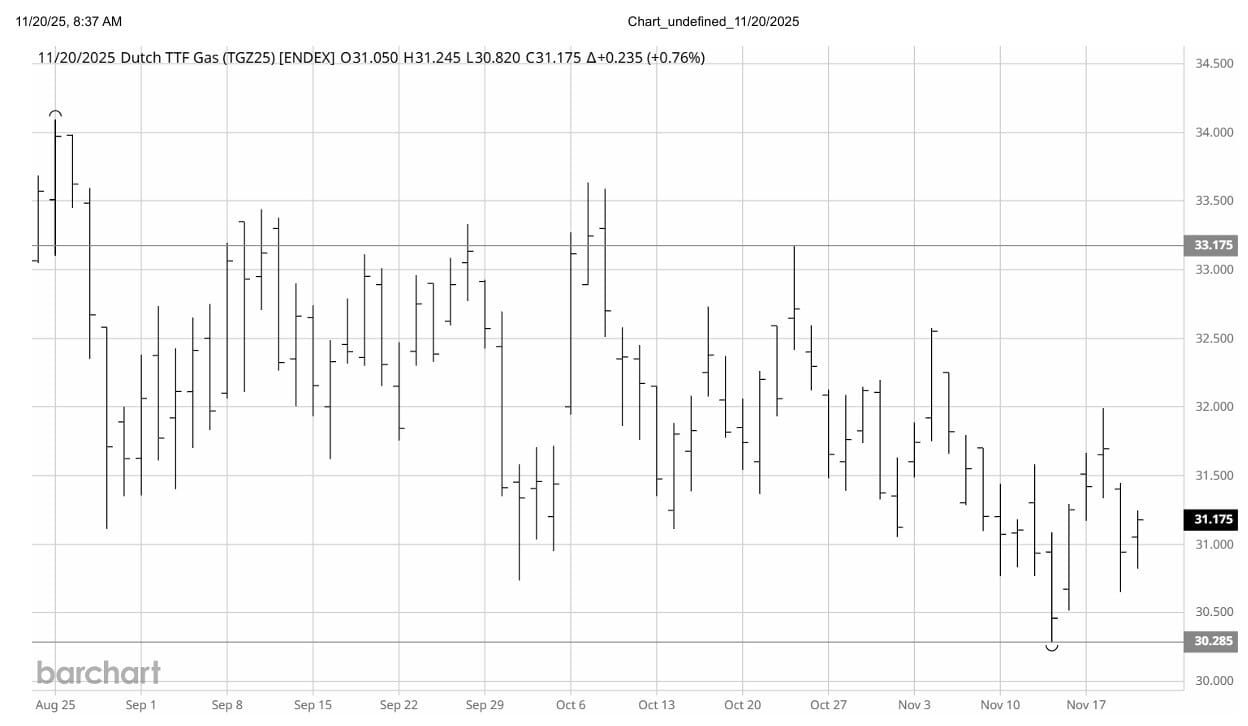
ING reporting shows net long positioning in the TTF futures to have been pared to its lowest level since March 2024. This was driven by fresh shorts, which ING says have reached a record gross position, which they add leaves the market prone to a possible short covering rally in the event of any supply surprises or extended cold snaps over the winter. The possibility for a US peace deal in Ukraine is a negative for the contract, while inventories at 81% is supportive as they are down from a peak of just over 83% in mid-October. The 5-year average for this time of year is 91% full. (Barchart) Analysts from trading firm Mind Energy wrote the market seemed to be shrugging off approaching cold weather and pipeline constraints from Norway and Algeria. (NGI) Technically TTF prices have been in an overall range for the past 3 months.
Technically DC chart momentum for the NG futures is negative, despite the strong upward movement seen in prices the past 2 sessions. Support lies at 4.350 and then at 4.268-4.273. Resistance is seen at 4.581-4.582 and then at the 4.688 high.
Enjoyed this article?
Subscribe to never miss an issue. Liquidity’s Daily Energy Market Updates provide a comprehensive analysis of both the fundamentals and technical factors driving energy markets.
Click below to view our other newsletters on our website:
Disclaimer
This article and its contents are provided for informational purposes only and are not intended as an offer or solicitation for the purchase or sale of any commodity, futures contract, option contract, or other transaction. Although any statements of fact have been obtained from and are based on sources that the Firm believes to be reliable, we do not guarantee their accuracy, and any such information may be incomplete or condensed.
Commodity trading involves risks, and you should fully understand those risks prior to trading. Liquidity Energy LLC and its affiliates assume no liability for the use of any information contained herein. Neither the information nor any opinion expressed shall be construed as an offer to buy or sell any futures or options on futures contracts. Information contained herein was obtained from sources believed to be reliable, but is not guaranteed as to its accuracy. Any opinions expressed herein are subject to change without notice, are that of the individual, and not necessarily the opinion of Liquidity Energy LLC
Reply