- Daily Energy Market Update
- Posts
- Daily Energy Market Update November 18,2025
Daily Energy Market Update November 18,2025
Liquidity Energy, LLC
Randall Rothenberg
November 18, 2025
In partnership with
July 25, 2026
January WTI is up 9 cents at $59.95 January RB is down 1.02 cents at 1.9034 January ULSD is up 5.68 cents at $2.5531
Liquidity’s Daily Market Overview
Energies are mixed with January WTI up slightly, January RB is down, but January HO is up strongly on the back of the narrative of tight distillate inventories in winter due to Russian supply worries. Crude oil remains weighed down by worries over rising supply. Crude oil is being held back somewhat by the fact that loadings resumed Sunday at the key Russian hub of Novorossiysk after a 2 day suspension.
Asian gasoil cracks has hit a 2-year high of $29 as the Russian risks tighten supply, according to Quantum Commodities reporting. In Asia, front month spot activity remains supported by the firm supply-demand fundamentals, but could ease by first half of December as some refineries gradually resume production after maintenance. The gains in European Gasoil prices are said to be a function of limited import arrivals heading into northwest Europe markets in December, two trade sources say. (Reuters) Morgan Stanley now says that between 150 and 200 MBPD of diesel supply--around 2% of global supply--could be curtailed if Turkey and Brazil reduce their imports from Russia. (WSJ)
Chinese diesel exports in December are seen below 400,000 tonnes. In October Chinese diesel exports were running at 740,000 tonnes. Reuters reporting has Chinese diesel exports having averaged 582,000 tonnes in the first 10 months of this year. The amount of diesel China exports is heavily influenced by the export quotas granted by the Chinese government to state-owned refiners; thus, December's lower export level may be a function of the refiners having used up much of the quotas for 2025.
The U.S. Treasury said on Monday that U.S. sanctions against Russian oil majors Rosneft and Lukoil are already reducing Russian oil revenues and are likely to reduce the quantity of Russian oil sold in the long term. November 21 is the deadline for companies to wind down dealings with Rosneft and Lukoil. LSEG Workspace data on Monday showed benchmark Urals crude loaded at Russia's Black Sea oil hub of Novorossiysk traded at $45.35 per barrel on November 12, the lowest level since March 2023. (Reuters)
As an example of Russian sales declining : " Chinese refiner Yanchang Petroleum has bought 3 MMBBL of crude from the UAE and Kazakhstan for January arrival, several trade sources said, after suspending Russian oil purchases over concerns about Western sanctions." (Reuters)
Goldman Sachs sees a 2.0 MMBPD supply surplus developing in 2026. "The 2025-2026 supply wave mostly results from long-cycle projects that saw Final Investment Decisions (FIDs) just before the pandemic, got delayed during Covid, and are now all coming online and from OPEC's strategic decision to unwind production cuts," the bank noted. The bank forecast Brent crude will average $56 a barrel and WTI $52 in 2026. But, lower oil prices will limit supply growth and will lead to a supply deficit in the 2nd half of 2027, they say. The low 2025–2026 prices will weigh on non-OPEC production and there are very few new projects that will come online after 15 years of underinvestment. "We therefore expect Brent/WTI to rise to our long-run $80/76 forecasts by late 2028," the bank said. (Reuters)
Nearly 82 million Americans are projected to travel over Thanksgiving, as per the AAA. That would be a record number of travelers. This year's amount of travelers is an increase of 1.6 million travelers year on year and could be the single busiest holiday over Memorial Day and July 4th. Seventy three million of the travelers will be driving in their cars, an increase of 1.3 million from last year.
Energy Market Technicals
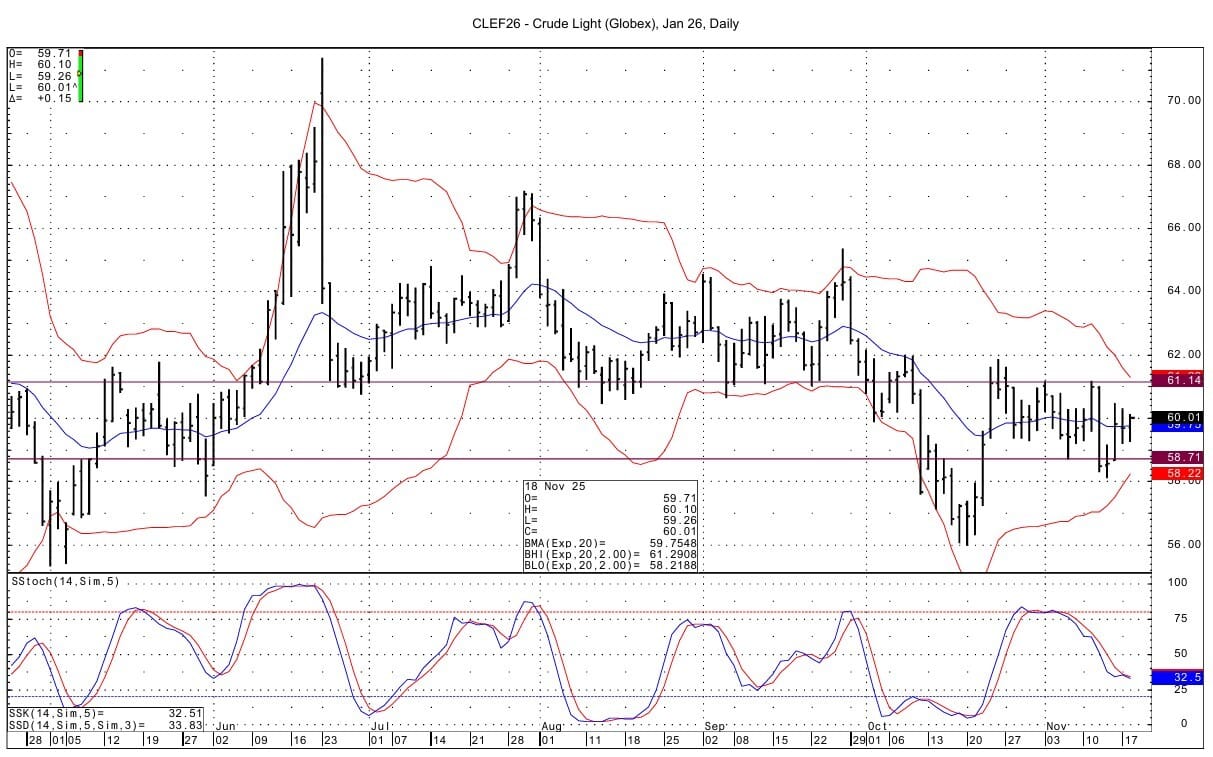
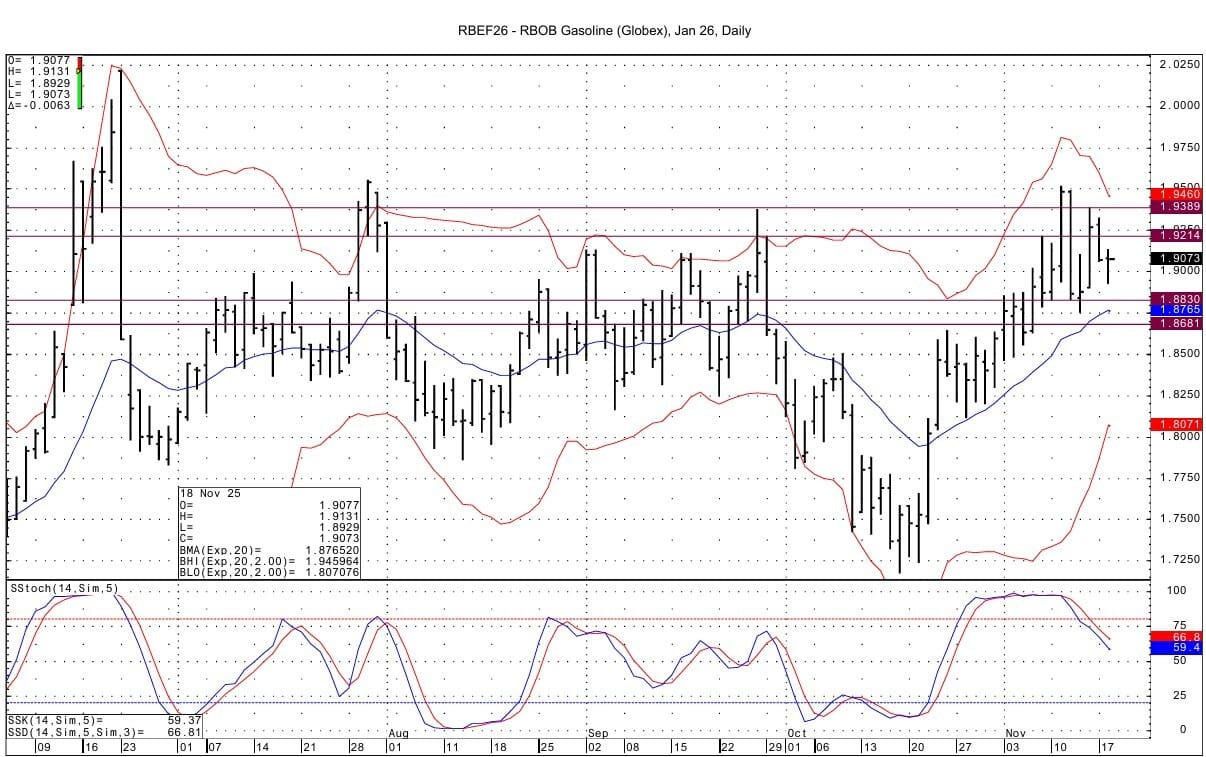
We have switched to January for technical commentary, as that is now the month with the highest traded volume in the energies. Momentum for the WTI and HO are trying to stay negative. RB momentum is negative.
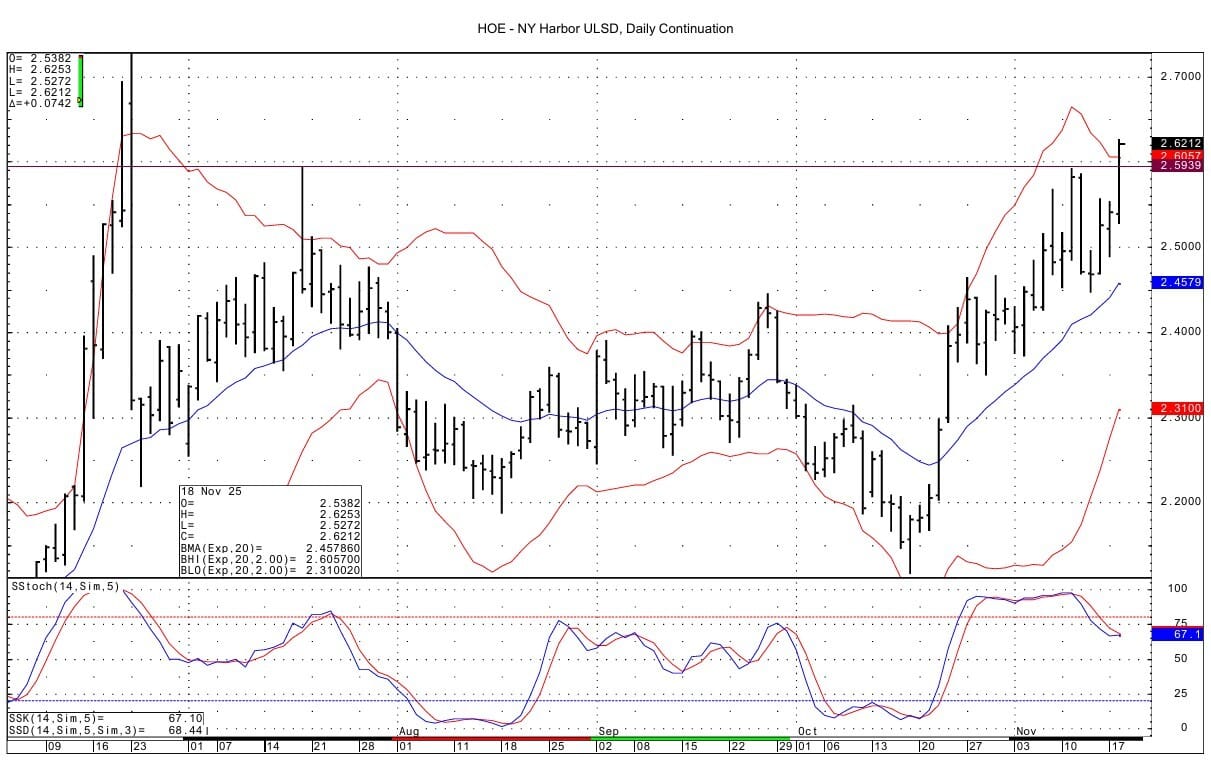
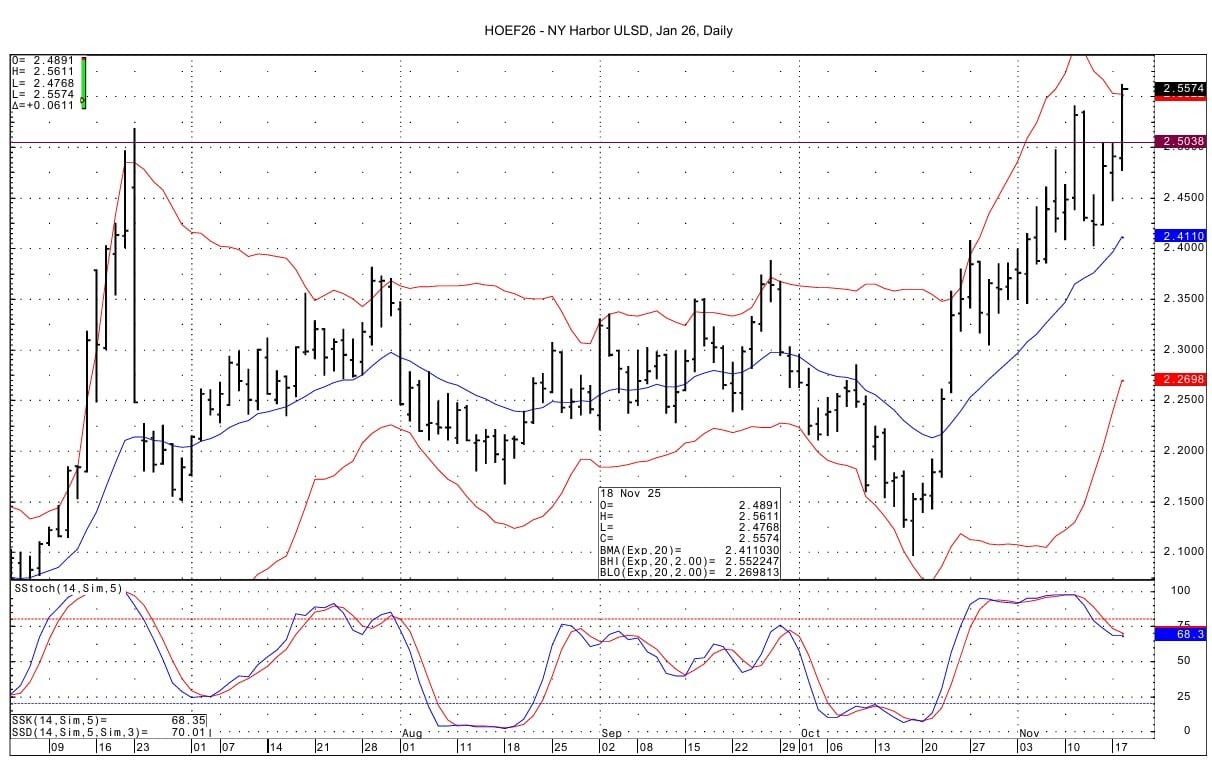
January HO has traded today to a fresh record for the contract. The front month HO contract is at its best value since late June. January ULSD has resistance at 2.5926-2.5939 from highs from the DC chart. We see support coming in at the prior 2 sessions' highs at 2.5038-2.5041. The upper bollinger band on the January daily chart intersects at 2.5525. The DC chart upper bollinger band intersects at 2.6060.
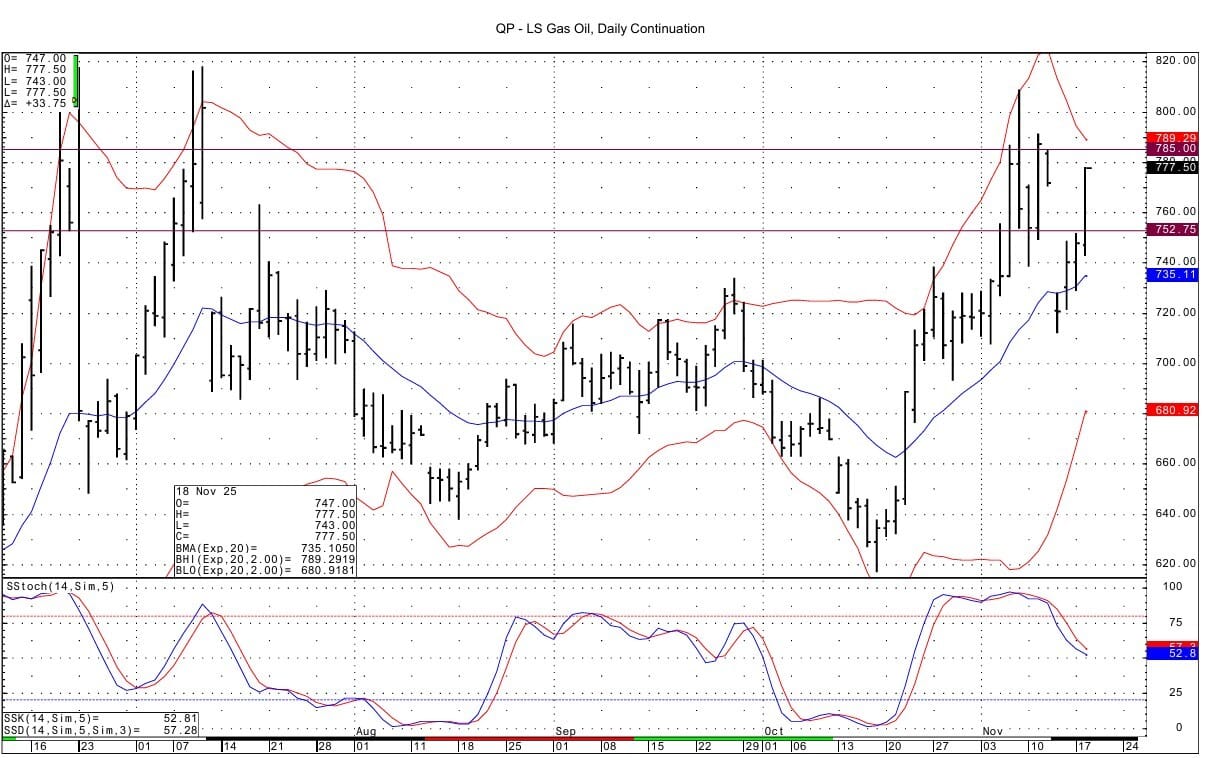
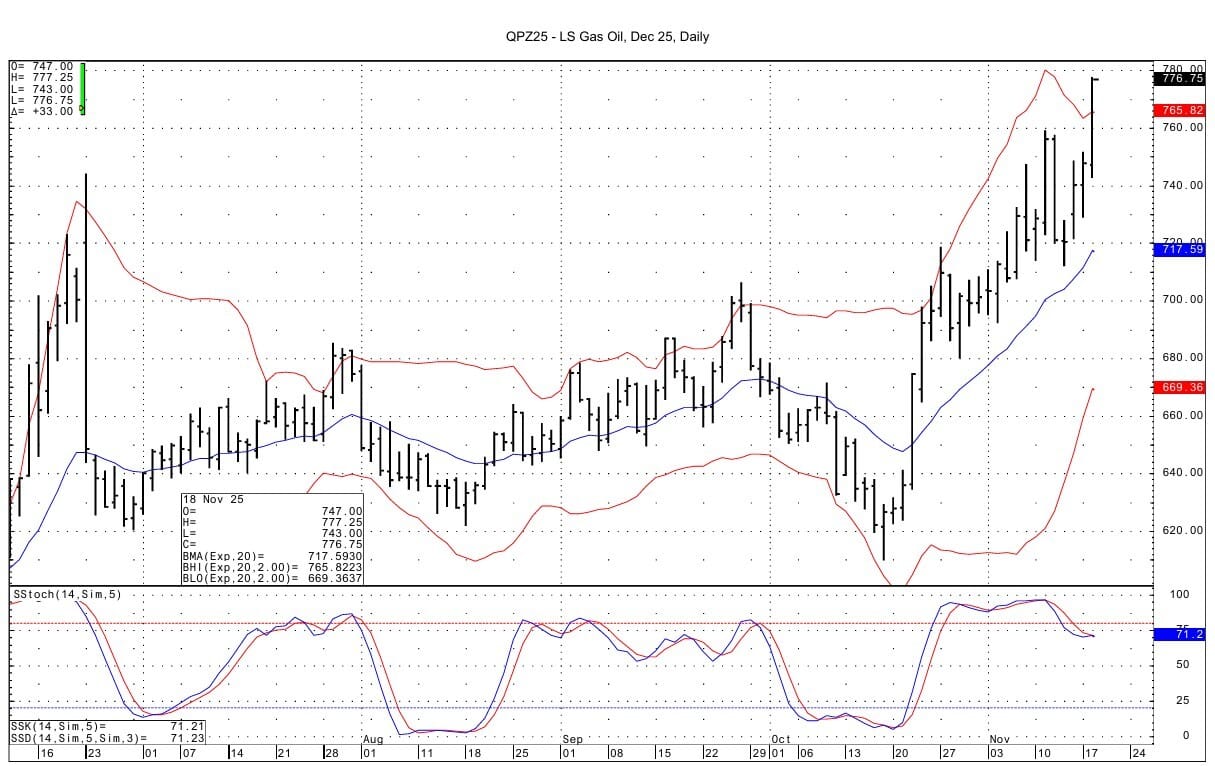
The December front month Gasoil futures rose today to fill a gap on the DC chart that lay up to 770.75. Resistance for the spot Gasoil futures is seen at 785.00 from data from the DC chart. Support lies at 752.50-752.75. Here too the contract is trading above the daily chart upper bollinger band that intersects at 765.82.
January WTI support lies at 58.66-58.71, while resistance lies at 61.14-61.18. As one analyst wrote : crude oil is rangebound.
January RB support comes in at 1.8830-1.8835 and then at 1.8681-1.8687. Resistance lies at 1.9214-1.9222 and then at 1.9379-1.9389.
Natural Gas Market Overview
Natural Gas---Dec NG is down 2.7 cents at $4.334
NG futures are lower, continuing to be pressured by a warmer forecast for the coming week and by the ample amount of gas in storage. A slight dip in feedgas volume may also be weighing on prices.
Spot NG futures sold off Monday as weather forecasts remain mild. Meteorologists forecast temperatures across the country will remain mostly warmer than normal through December 2, which should limit heating demand. Warmer-than-normal temperatures are forecast early in the Nov. 22-26 period for the eastern half of the US, particularly in the Midwest and South. Readings are closer to normal in the Northeast for the period, as per weather forecaster Vaisala. Celsius Energy added that computer models backed away from a late November & early December arctic outbreak with Gas-Weighted Degree Days (GWDDs) now expected to be below average through the 15-day period at 5 year lows.
LSEG data shows November US natural gas production averaging 109.3 BCF/d so far, up from 107.3 BCF/d in October and above the record seen in August of 108.3 BCF/d. BNEF estimated Monday's lower 48 dry gas production at 111.0 BCF/d. This compares to their November average so far of 110.1 BCF/d.
LSEG says that the feedgas volume in November has averaged 17.9 BCF/d so far, up from October's record of 16.6 BCF/d. Saturday 11/15 saw the feed gas volume setting a daily record of 18.6 BCF/d. (Reuters) Today's feedgas volume has dipped to 17.50 BCF/d, down 0.589 BCF from yesterday. The previous week's average was 18.26 BCF/d. (Market News)
Early estimates we are seeing for this week's EIA gas storage data are calling for a draw of 12 to 18 BCF. This compares to last year's build of 3 BCF and the 5 year average build for the period of 12 BCF.
The January LN put option open interest rose by 20,206 contracts in Monday's activity. Notable increases were seen in the $4.50 and $4.25 strikes. The $4.50/$4.25 put spread traded in a 1 by 2 ratio with the buyer of the $4.50 put collecting 7.7 cents with delta futures sales at $4.66. The February March one month CSO puts traded actively in the +35 cent and +25 cent strikes. The spread traded in a 1 by 2 ratio with the buyer of the +35 cent put collecting 1.2 cents. The February/March futures spread settled Monday at +44.7 cents.
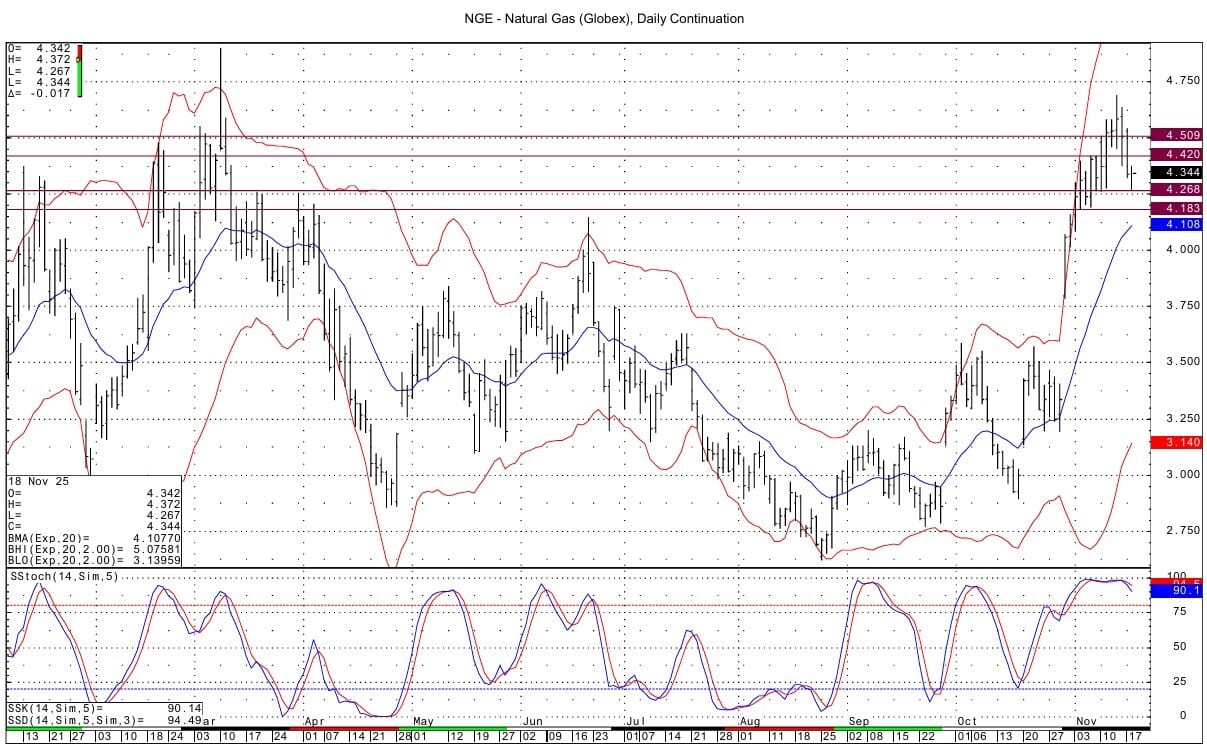
Monday's NG spot futures selloff was the largest one day dollar decline since Monday, July 21, 2025. Technically, the DC NG futures chart shows momentum having turned downward from an overbought condition. Support for the spot futures comes in at 4.268-4.276, which has been tested today with a low of 4.267. Below that support lies at 4.183-4.192. Resistance lies at 4.419-4.420 and then at 4.509-4.518.
Enjoyed this article?
Subscribe to never miss an issue. Liquidity’s Daily Energy Market Updates provide a comprehensive analysis of both the fundamentals and technical factors driving energy markets.
Click below to view our other newsletters on our website:
Start investing right from your phone

Jumping into the stock market might seem intimidating with all its ups and downs, but it’s actually easier than you think. Today’s online brokerages make it simple to buy and trade stocks, ETFs, and options right from your phone or laptop. Many even connect you with experts who can guide you along the way, so you don’t have to figure it all out alone. Get started by opening an account from Money’s list of the Best Online Stock Brokers and start investing with confidence today.
Disclaimer
This article and its contents are provided for informational purposes only and are not intended as an offer or solicitation for the purchase or sale of any commodity, futures contract, option contract, or other transaction. Although any statements of fact have been obtained from and are based on sources that the Firm believes to be reliable, we do not guarantee their accuracy, and any such information may be incomplete or condensed.
Commodity trading involves risks, and you should fully understand those risks prior to trading. Liquidity Energy LLC and its affiliates assume no liability for the use of any information contained herein. Neither the information nor any opinion expressed shall be construed as an offer to buy or sell any futures or options on futures contracts. Information contained herein was obtained from sources believed to be reliable, but is not guaranteed as to its accuracy. Any opinions expressed herein are subject to change without notice, are that of the individual, and not necessarily the opinion of Liquidity Energy LLC
Reply