- Daily Energy Market Update
- Posts
- Daily Energy Market Update May 11, 2026
June 26, 2026
Liquidity’s Daily Market Overview
Morning Energy Market Update
Energy markets remain focused on developments surrounding the Strait of Hormuz after President Trump rejected Iran’s response to the latest U.S. peace proposal, calling it “totally unacceptable.” The continued stalemate has kept geopolitical risk premium elevated across crude and LNG markets.
Crude prices rallied overnight on the headlines, with Brent briefly trading near $106 and WTI reaching 100.37 before pulling back into the U.S. open. The market remains sensitive to any developments tied to Hormuz, which prior to the conflict handled roughly 20% of global oil and LNG flows.
While some tankers have resumed limited transit through the strait, shipping disruptions and elevated security risks continue to keep global energy markets tight. Saudi Aramco also warned over the weekend that even if Hormuz were reopened immediately, it could still take months for energy markets to fully normalize.
For now, uncertainty surrounding negotiations between the U.S. and Iran remains one of the primary drivers behind the recent volatility in crude oil and refined products.
Energy Market Technicals
Crude (CLM6)
Crude Oil – CLM6
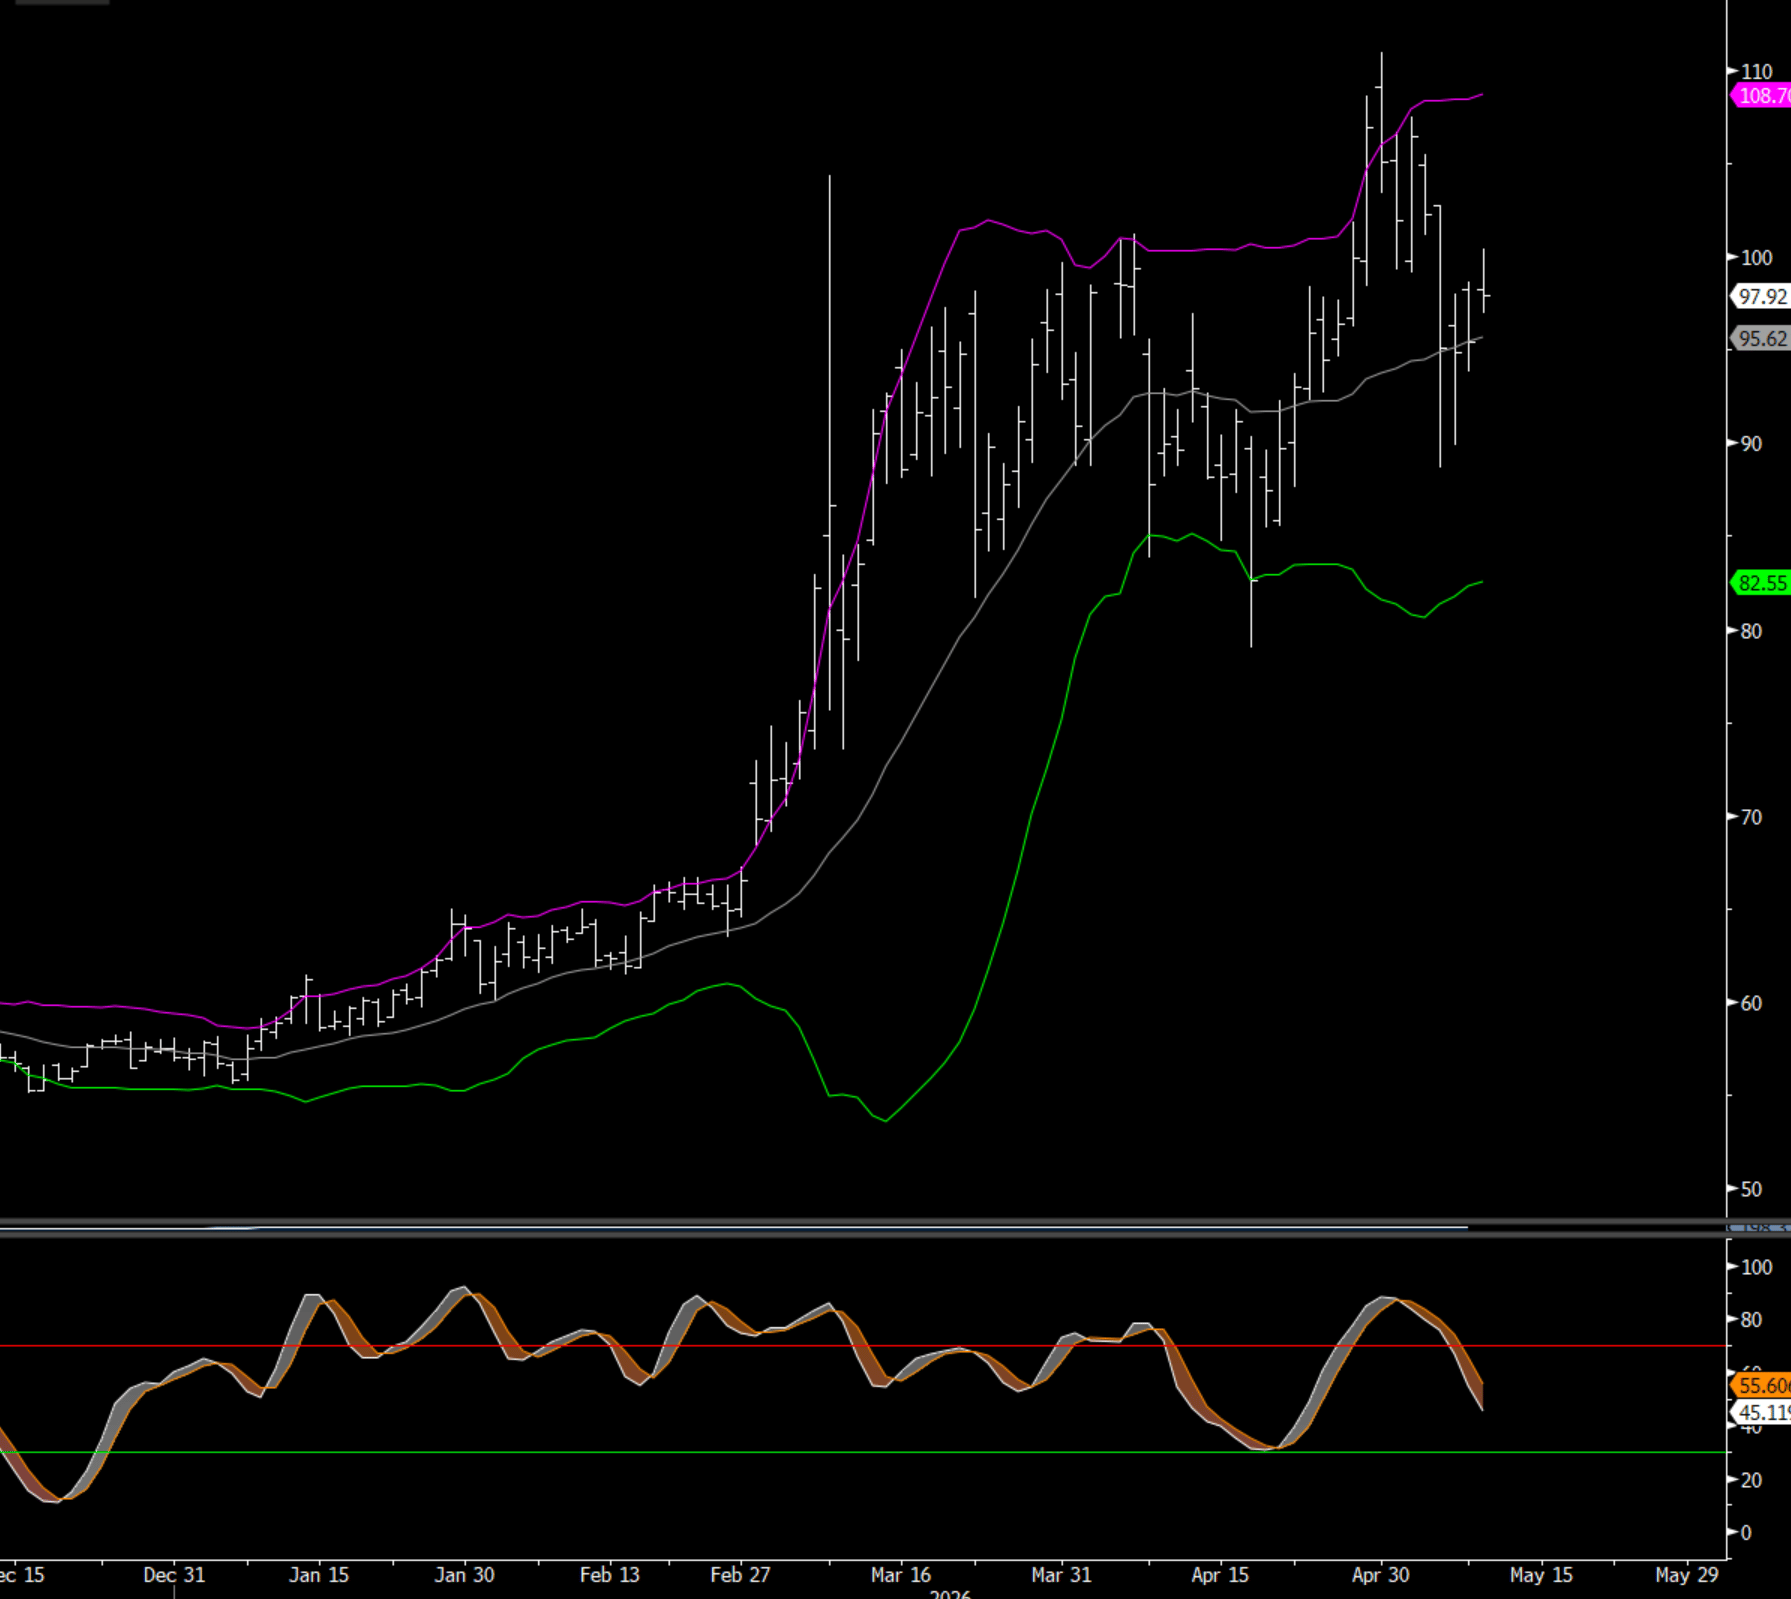
For most of the past 2½ months, crude has traded within a broad range between 80 and 101. At the end of April, crude broke above the top of that range and rallied to a high of 110.93. However, on May 6th the market fell back below 101, moving back into the prior trading channel.
This morning, crude tested resistance near the top of the channel but has since backed off the highs. The session high was 100.37, and as of the U.S. open we are trading at 98.02, up 2.62 from Friday’s close.
Momentum indicators are currently in neutral territory but continue to point lower, suggesting upside momentum remains limited unless buyers can reclaim the 101 area decisively.
Support levels to watch:
95.62 – 20-day moving average
88.66 – Last Wednesday’s low
82.55 – Lower Bollinger Band
Resistance levels:
101.00 – Top of the trading channel
108.70 – Upper Bollinger Band
110.93 – April 30th high and bearish reversal bar
Heating Oil (HOM6):
Heating Oil – HOM6
Heating oil is also starting the session higher but has pulled back from the overnight highs ahead of the U.S. open. Momentum remains elevated overall, though indicators are beginning to point lower, suggesting rallies may continue to face headwinds in the near term.
Support levels to watch:
3.7999 – 20-day moving average
3.5538 – Spike low from last Wednesday
Resistance levels:
4.2390 – Upper Bollinger Band
4.2549 – April 30th reversal bar high

Crude Spread (CLZ6/CLZ7)
CLZ6/CLZ7 Spread
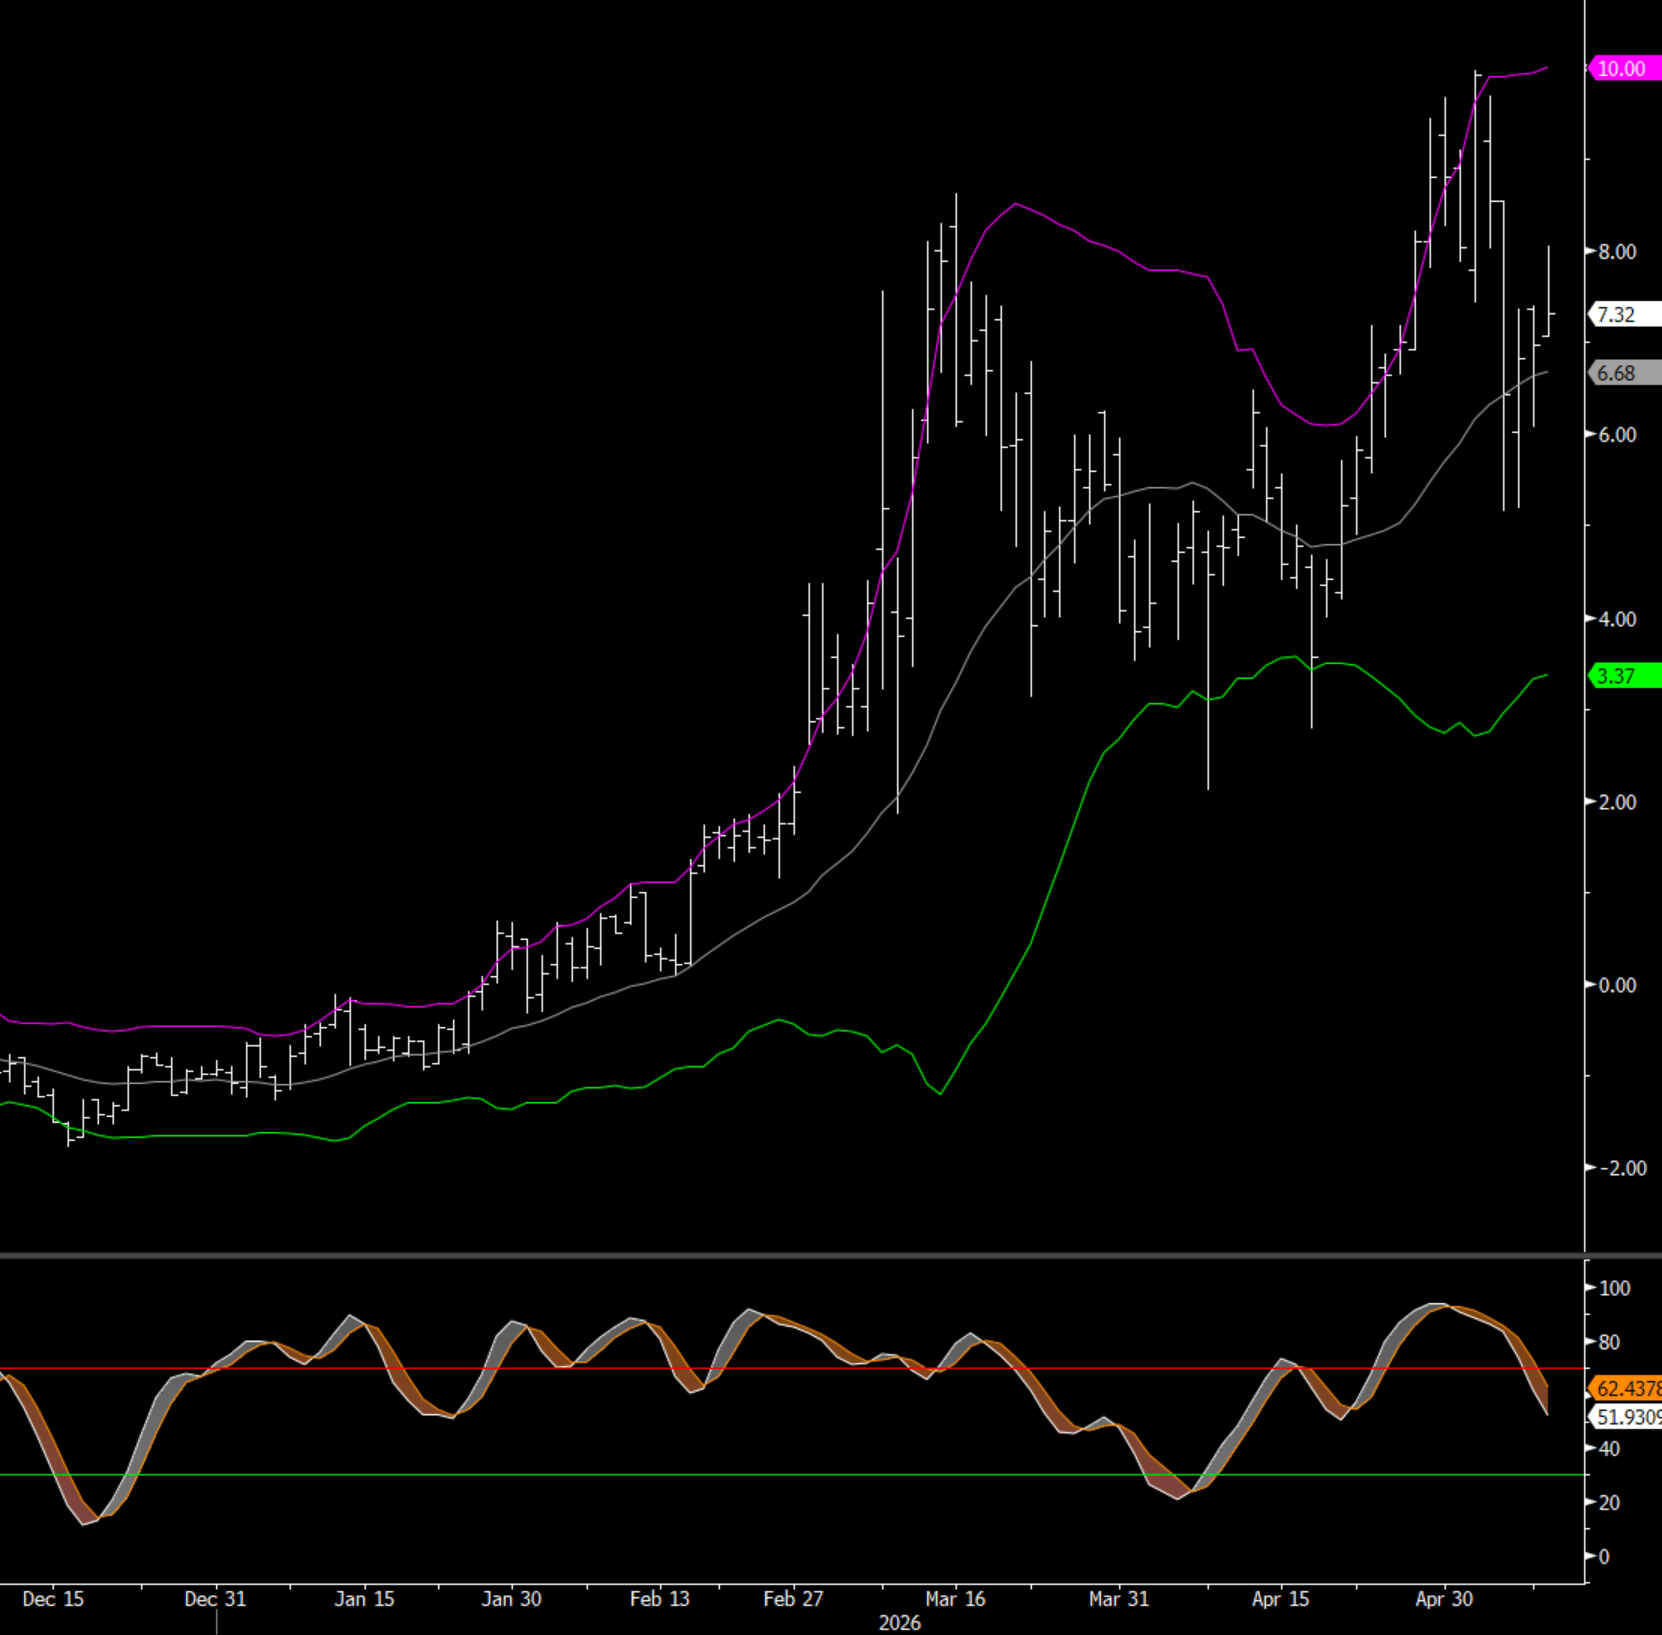
The CLZ6/CLZ7 spread is opening the U.S. session up 0.36 at 7.33 after trading as high as 8.06 overnight. Momentum indicators are still pointing lower overall but have moved closer to neutral territory, suggesting downside pressure may be moderating.
Support levels to watch:
6.69 – 20-day moving average
5.16 – Double bottom from last week
Resistance levels:
7.40 – Double top formed late last week
10.00 – Upper Bollinger Band and the high from the beginning of last week
Natural Gas Market Overview
Natural Gas (NGM6):
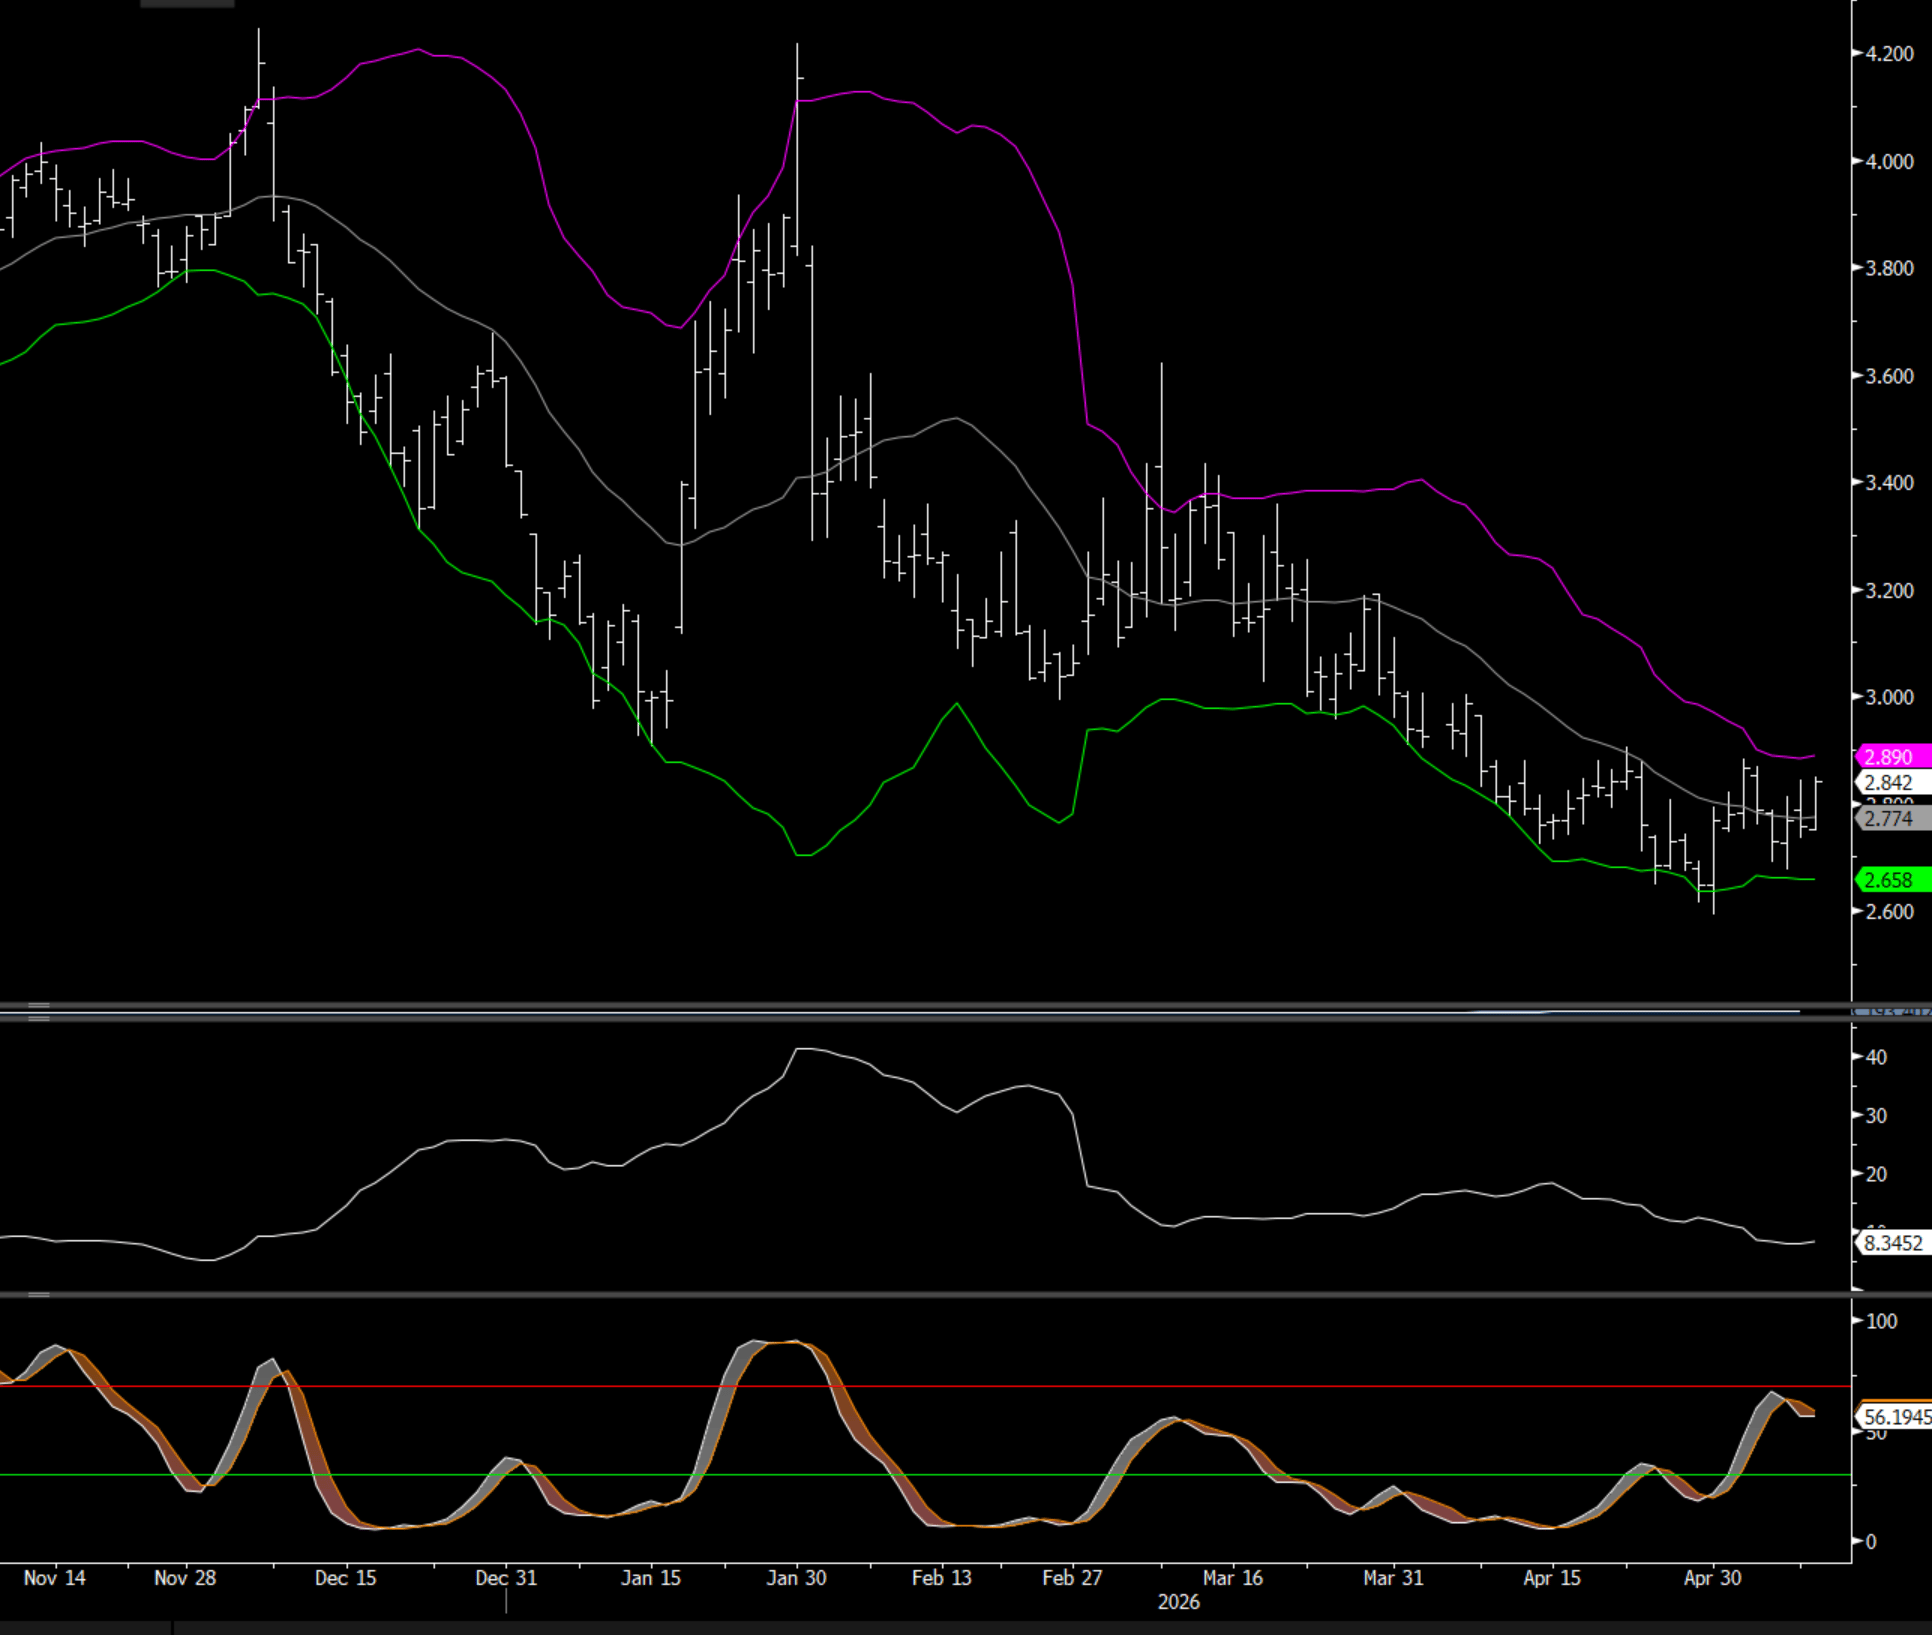
Natural gas is opening the U.S. session up 0.08 and trading near Friday’s highs, though still holding within the recent range.
The market remains compressed between the Bollinger Bands, which currently come in between 2.65 and 2.88. Watching closely to see whether we continue to see further volatility compression or if price begins to break outside of that range.
Bollinger Band width — a measure of volatility — remains at multi-month lows, keeping the focus on the potential for a larger directional move once this range resolves.
For additional context on the competing technical setups and what similar volatility compression has led to historically, see Friday’s special report: “The Next Move.”
Enjoyed this article?
Subscribe to never miss an issue. Liquidity’s Daily Energy Market Updates provide a comprehensive analysis of both the fundamentals and technical factors driving energy markets.
Click below to view our other newsletters on our website:
Disclaimer
This article and its contents are provided for informational purposes only and are not intended as an offer or solicitation for the purchase or sale of any commodity, futures contract, option contract, or other transaction. Although any statements of fact have been obtained from and are based on sources that the Firm believes to be reliable, we do not guarantee their accuracy, and any such information may be incomplete or condensed.
Commodity trading involves risks, and you should fully understand those risks prior to trading. Liquidity Energy LLC and its affiliates assume no liability for the use of any information contained herein. Neither the information nor any opinion expressed shall be construed as an offer to buy or sell any futures or options on futures contracts. Information contained herein was obtained from sources believed to be reliable, but is not guaranteed as to its accuracy. Any opinions expressed herein are subject to change without notice, are that of the individual, and not necessarily the opinion of Liquidity Energy LLC
Reply