- Daily Energy Market Update
- Posts
- Daily Energy Market Update March 10,2026
July 27, 2026
WTI is down $5.67 at $89.10 May RB is down 9.70 cents at $2.6667 ULSD is down 3.97 cents at $3.5469
Liquidity’s Daily Market Overview
Energy prices are lower versus Monday's settlement, but have basically stabilized after the sharp fall post close Monday after President Trump, in an interview with CBS News, said that the war in Iran is "very complete, pretty much,". But, skepticism still remains as to energy prices falling.
Additionally, President Trump signaled that he would waive oil-related sanctions and get the US Navy to escort tankers through the vital Strait of Hormuz. Investors have been skeptical about moves by the Trump administration to calm energy markets, but his latest remarks underscored a new willingness by the White House to publicly indicate that it could be moving to end the war, as per Bloomberg commentary. President Trump didn’t offer additional specifics on the plan to escort tankers or waive oil-related sanctions, beyond acknowledging he had discussed the topic with Russian President Vladimir Putin in a phone call earlier Monday. Last week, the Trump administration cleared the way for India to temporarily increase its purchases of Russian crude. (Bloomberg)
In response to Trump, Iran's Islamic Revolutionary Guards Corps said they would "determine the end of the war" and Tehran would not allow "one litre of oil" to be exported from the region if U.S. and Israeli attacks continued, state media reported on Tuesday. (Reuters)
Saudi Arabia’s Aramco, the world’s top oil exporter, said on Tuesday there would be "catastrophic consequences" for the world’s oil markets if the Iran war continues to disrupt shipping in the Strait of Hormuz. Aramco's CEO said:" this is by far the biggest crisis the region’s oil and gas industry has faced." "Unfortunately, for global markets, most of the spare capacity is in this region," he added. "Even with our ability to export through the western region, you’re talking about close to 350 million barrels of disruptions that will come off the market," he said.(Reuters)
Skepticism though remains about the oil markets' price easing. "Trump's words will only go so far," analysts at ING said. "Ultimately, the market will need to see a resumption of oil flows through the Strait of Hormuz to sustain a move lower in oil prices." "Murban and Dubai grades are still well above $100 per barrel, so practically nothing much has changed in terms of ground realities," one bank analyst added, referring to benchmark Middle Eastern oil grades. As per another bank analyst : "the reality as of today is that the Strait of Hormuz remains effectively shut, halting 10 -11 MMBPD of crude flows, and upstream shut-ins continue to rise, now exceeding 6 MMBPD."
Volumes though have fallen in today's trading. Volumes in spot Brent futures earlier had dropped to about 213,000 contracts, the lowest amount since February 27, just before the start of the conflict. Volumes in spot WTI futures fell to 212,000, the lowest since February 20, as per Reuters reporting.
G7 nations said on Monday they were prepared to implement "necessary measures" in response to surging global oil prices but stopped short of committing to the release of emergency reserves. (Reuters)
Retail fuel prices at the pump in the US continue to rise. Gasoline prices today are averaging $3.539, as per AAA data. Today's price is up 6.1 cents from yesterday and up 55.7 cents from before the Iran war. The average diesel price at the pump rose today to $4.780. Today's price rose by 12.4 cents from yesterday and is up $1.023 from February 27.
Energy Market Technicals
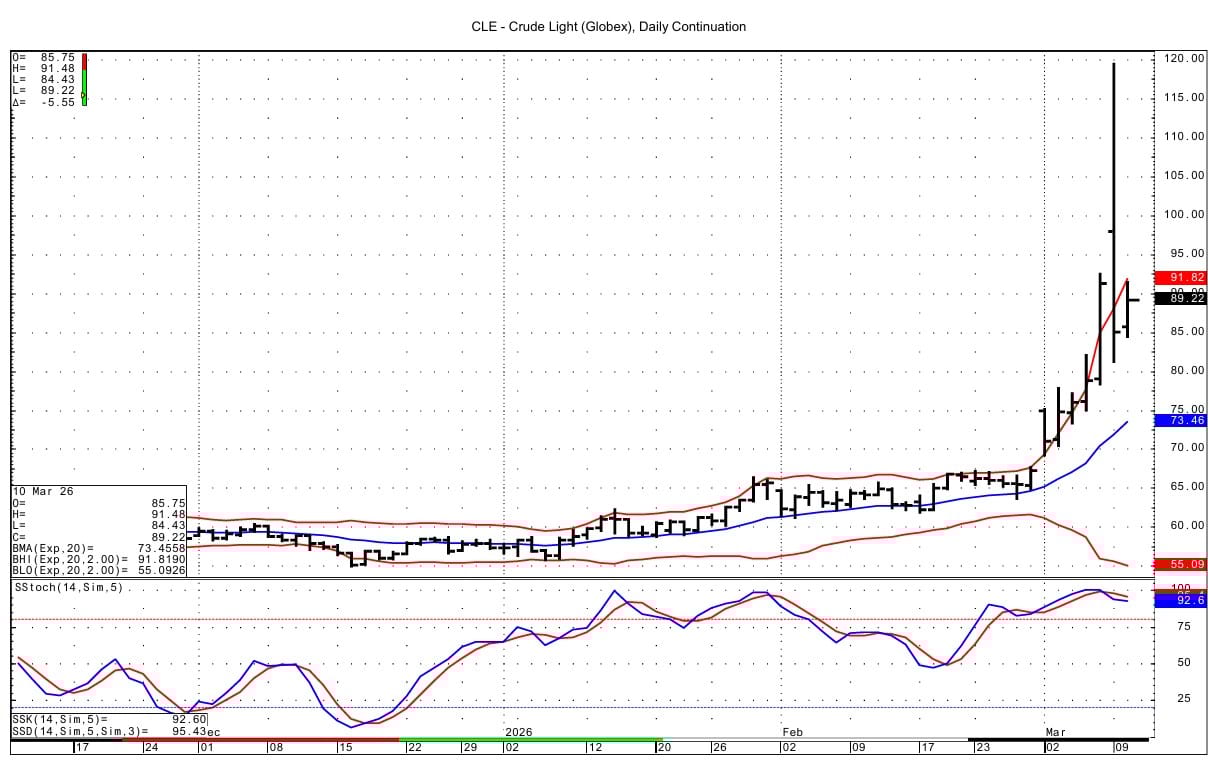
Momentum has turned negative for the energies from the extremely overbought condition that existed the past 2 sessions. Additionally the energies have fallen to now trade below their respective upper bollinger bands, after spending the past 3 sessions trading above the upper bands.
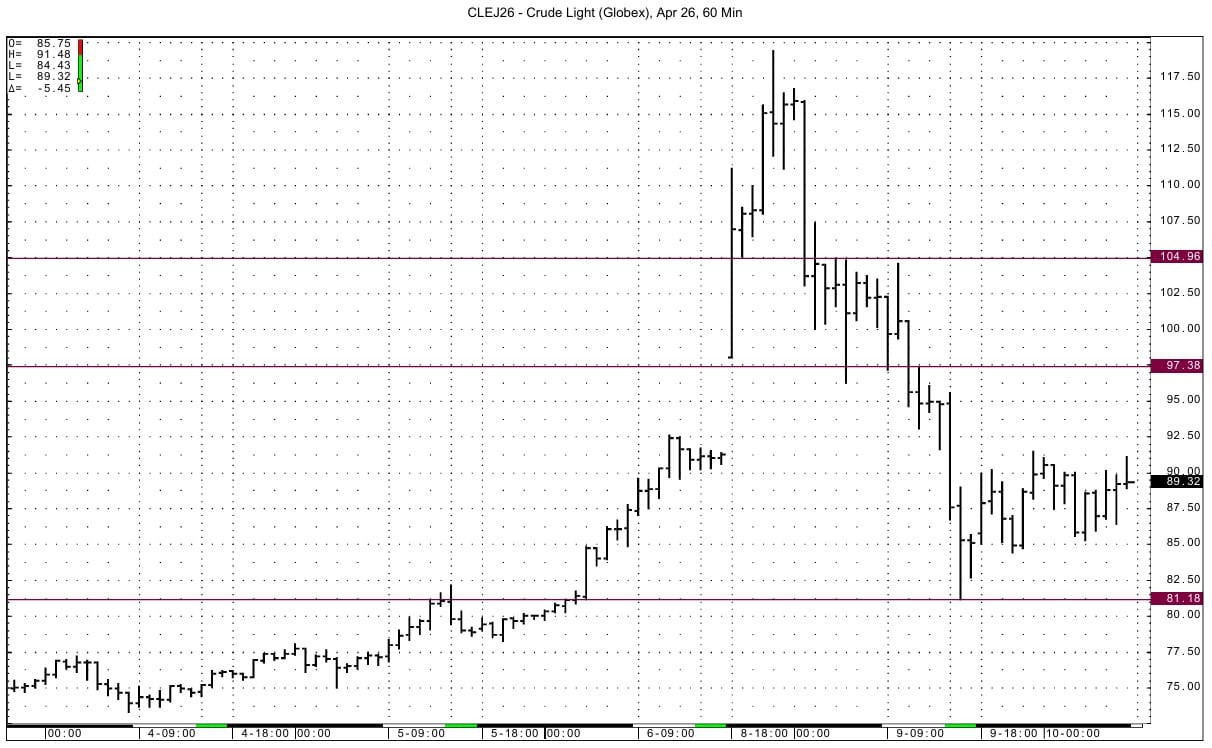
Spot WTI futures have support at 81.13-81.19, which is yesterday's low. Resistance is seen at 97.19-97.38 and then at 104.81-104.96. The DC chart's upper bollinger band intersects at 91.81.
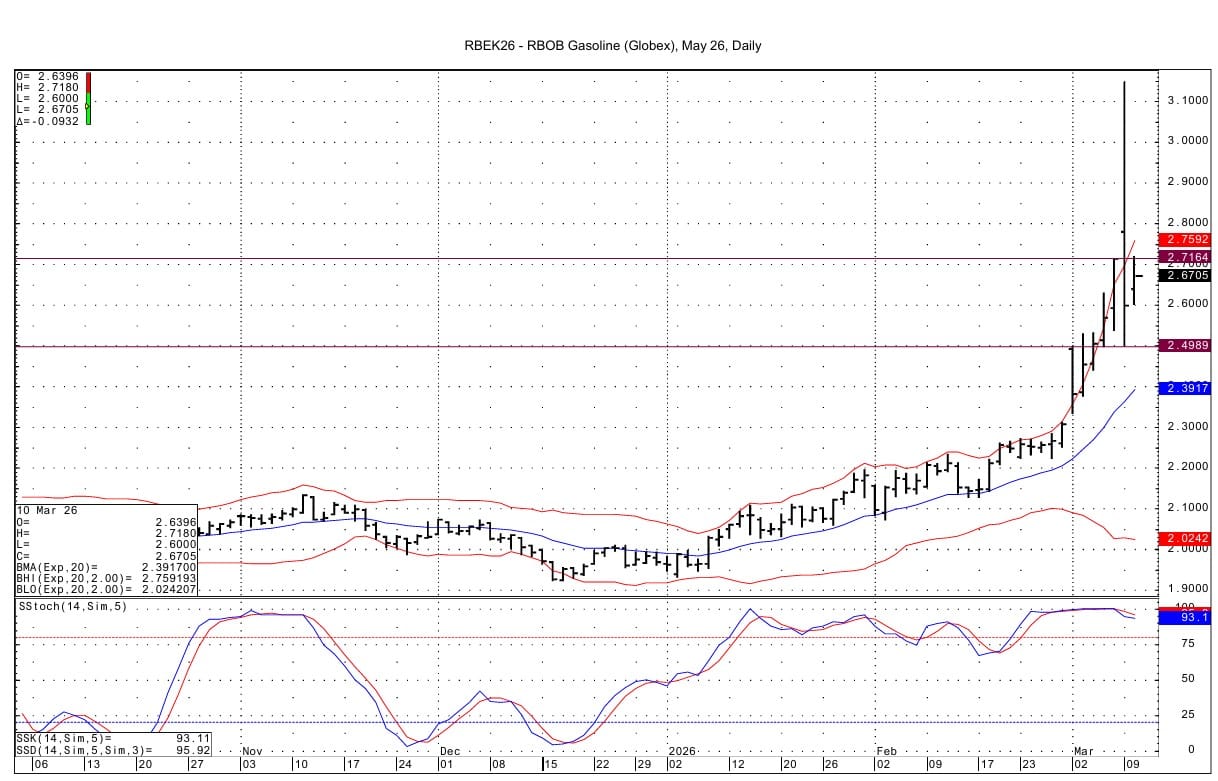
May RB sees support at 2.6000-2.6013 and then at 2.4980-2.5006. Resistance comes in at 2.7164-2.7180 and then at 2.7862. The upper bollinger here lies at 2.7592.

Spot ULSD futures see support at 3.3666-3.3692. Resistance is seen at 3.7485. The upper bollinger band here basis the DC chart intersects at 3.8389.

Natural Gas Market Overview
Natural Gas --NG is down 7.7 cents at $3.043
NG futures are lower as they have fallen back to the range that existed most of this month -prior to the past 2 sessions' rallies. President Trump's comments on the Iran war being complete is weighing on NG as well as TTF prices, which have gapped lower. NG prices are lower even as feedgas demand has rebounded and the weather forecast added some demand.
The European TTF futures have gapped back down today, creating an island top from yesterday's rise to the multi year high. The news from President Trump that the Iran war could end soon has seen the TTF fall, even as European gas inventories remain low. As of early March 2026, EU natural gas storage levels have dropped below 30% capacity (approx. 29.4% as of March 7), falling to their lowest levels since 2022 due to a colder-than-expected winter and increased demand. Storage is expected to end the winter season (late March) at a 22-27% capacity range, well below the 5-year average of 41%. (Energie-Dashboard Bundesamt) TTF prices are down about 13% today after settling higher Monday by 5.74%; the contract was up 30% at its high of Euro 69.500 Monday. The gap today goes from Euro 50.945 up to 55.750. The gap created Monday goes from that low of 55.750 down to 53.835. Momentum basis the TTF DC chart has turned negative with the selloff today after spending the whole session yesterday above the DC chart's upper bollinger band.

Market News data shows LNG terminal feedgas demand is estimated 0.972 BCF/d higher today at 18.68 BCF/d. Freeport feedgas has recovered back to near normal levels today after the outage earlier this week, Market News adds.
Lower 48 states dry gas production was estimated at 114.33 BCF/d yesterday, up from Sunday's output of 114.16 BCF/d and compared to a 30-day average of 113.72 BCF/d, BNEF data shows.
The EIA gas storage data for this week is seen as a draw of 39 to 45 BCF. This compares to last year's draw of 62 BCF and the 5 year average draw of 64 BCF.
On Monday, in the LN/NG October January CSO, the -$1.00 call was sold versus buying of the -$1.50 put at a cost of 13.6 cents 5,000 lots worth. On Monday, the Oct Jan futures spread settled at -$1.409. In the April $2.50 puts, 3,000 contracts traded 1.6 cents. In the August LN options, the $4.75/$7.00 Call Spread traded in a 1 by 1.5 ratio at a cost of 12.8 cents with 0.14 delta futures sold at $3.78. All of the above options traded were positions being opened as per CME data.
Notable from Friday's LN/NG options are trades in the October January CSO. 9,000 contracts of the -$1.00 call were sold against buying of the -$2.00 put at a cost of 7.5 cents. There were 0.41 delta futures traded with that option strategy. The October futures were bought at $3.735 against selling of the January futures at $5.285. Thus the spread difference in the futures was $1.55. A further 10,000 contracts of the -$1.00 call/-$2.00 put fence traded 9.0 cents ( with no futures traded against the fence.) Also in the NG/LN October January CSO, 6,000 -$1.50/-$1.00 call spreads traded 18.5 cents. The October January spread settled Friday at -$1.531. Also notable from Friday's LN NG options activity was the October $4/$5 call spread trading 5,000 contracts worth at 22.4 cents cost with 0.21 delta futures sales at $3.78.
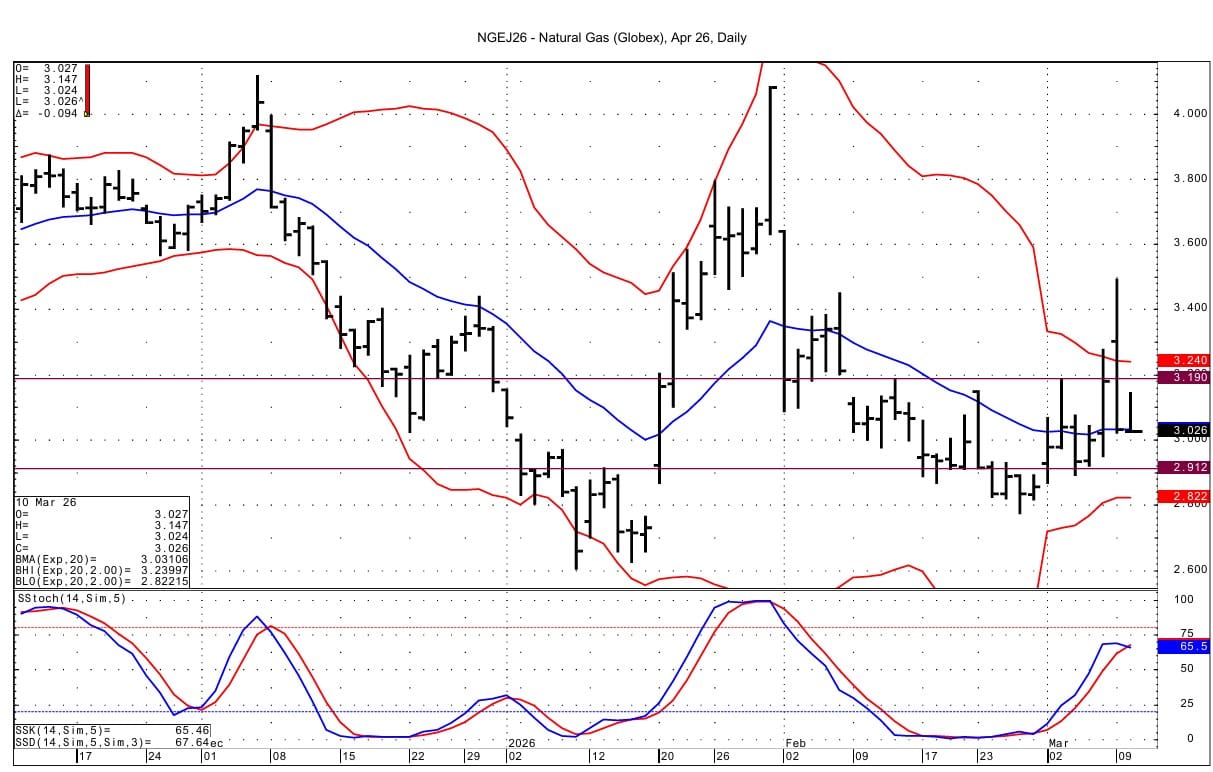
Technically NG futures basis the April daily chart are showing momentum turning downward as the contract heads towards $3. Support below is seen at 2.910-2.912. Upside resistance lies at 3.188-3.190.
Enjoyed this article?
Subscribe to never miss an issue. Liquidity’s Daily Energy Market Updates provide a comprehensive analysis of both the fundamentals and technical factors driving energy markets.
Click below to view our other newsletters on our website:
Disclaimer
This article and its contents are provided for informational purposes only and are not intended as an offer or solicitation for the purchase or sale of any commodity, futures contract, option contract, or other transaction. Although any statements of fact have been obtained from and are based on sources that the Firm believes to be reliable, we do not guarantee their accuracy, and any such information may be incomplete or condensed.
Commodity trading involves risks, and you should fully understand those risks prior to trading. Liquidity Energy LLC and its affiliates assume no liability for the use of any information contained herein. Neither the information nor any opinion expressed shall be construed as an offer to buy or sell any futures or options on futures contracts. Information contained herein was obtained from sources believed to be reliable, but is not guaranteed as to its accuracy. Any opinions expressed herein are subject to change without notice, are that of the individual, and not necessarily the opinion of Liquidity Energy LLC
Reply