- Daily Energy Market Update
- Posts
- Daily Energy Market Update July 3,2025
WTI is down 16 cents RB is down 0.56 cents ULSD is down 0.84 cents
Liquidity’s Daily Market Overview
Energies are lower as OPEC+ is set to raise output and tariff uncertainty persists, as per news wire accounts. The crude oil build seen in the DOE data is also seen as a negative. Further concern may be coming from China's services sector data seen today and the U.S. private sector jobs data seen yesterday.
The 90-day pause on the implementation of higher U.S. tariffs ends on July 9, with several large trading partners yet to wrap up trade deals, including the European Union and Japan. The concern over tariffs comes even as trade deal with Vietnam was reached Wednesday. Under the agreement, the U.S. will apply a 20% duty on Vietnamese imports — sharply below the 46% rate Trump had imposed in early April. U.S. imports to Vietnam will meanwhile not be subject to tariffs. Trump also said that Vietnam had agreed to a 40% duty on any products that originally came from another country, but were sent to Vietnam for final shipment to the U.S. China has reportedly repeatedly relied on this practice, known as transshipping, to avoid trade barriers. “What we learned from the Vietnam deal is, if anything, the tariffs are going to go up from here, not down,", said one BofA strategist. Trade negotiations between the EU and U.S. have been challenging and slow to develop, with sources telling CNBC that a bare-bones “political” deal with scant initial details may be the the EU’s best hope at this point. Trump has called for tariffs as high as 50% on the EU, while the bloc has threatened wide-ranging countermeasures. (CNBC)
China's services activity expanded at the slowest pace in nine months in June, as demand weakened and new export orders declined amid a fragile trade truce with the United States, a private-sector survey showed on Thursday. The Caixin/S&P Global services purchasing managers' index (PMI), fell to 50.6 from 51.1 in May, marking the weakest expansion since September 2024 but remaining above the 50-mark separating expansion from contraction. (Reuters)
The June Non Farm Payroll (NFP) saw an increase of 147,000 jobs, beating the expectation for an increase of 110,000 jobs. April and May revisions added a further 16,000 jobs. WTI rose slightly on the news. The NFP number comes a day after ADP said that private sector employment fell by 33,000 jobs, which was unexpected. A rise in employment of 100,000 jobs was forecast for the ADP survey. The loss of jobs was the first such seen since March of 2023. (CNBC)
The OPEC+ will meet over the weekend, with recent reports showing that the cartel plans to boost production by 411 MBPD in August. (investing.com)
Product demand from the DOE data gives a mixed picture this week. Gasoline demand is down a lot--falling 1.048 MMBPD to 8.64 MMBPD. This lags the prior 2 years demand by 800 to 935 MBPD. But, the four-week average implied gasoline demand edged higher in line with the seasonal trend to remain towards the higher end of the previous five-year range. Distillate demand rose by 249 MBPD to a strong figure of 4.043 MMBPD. This beats the prior 2 years demand by 230 to 330 MBPD. But, some of the euphoria of that demand figure may be dialed back by the very strong distillate output figure seen in this week's DOE data. Distillate output rose on the week by 245 MBPD to a total 5.034 MMBPD. It seems refiners have changed their production mix to favor more distillate production as the gasoline production in this week's stats shows a drop of 491 MBPD to a total of 9.621 MMBPD. The strength in the distillate margins coupled with some weakness in gasoline margins seen over the past 4-6 weeks looks to have given incentive to refiners to change their refined product output mix. The 245 MBPD rise in production and a 341 MBPD fall in net exports of distillate helped counter stronger demand and thus limited the size of the overall draw in distillate supplies.
The net crude import number this week shows an increase of 2.940 MMBPD to a very high level of 4.614 MMBPD--relative to the recent weeks' figures that were under 3 MMBPD. Crude imports rose by 975 MBPD and exports fell by 1.965 MMBPD. Crude exports fell to the lowest level since July 2023 at 2.3 MMBPD. Thus, the increase in the net crude import figure would suggest an even bigger build by just over 20.5 MMBBL in overall crude inventories would have been possible. But, much of the supply increase inherent in the rise in net crude imports was negated by the EIA's crude adjustment accounting figure that showed a weekly decline of 1.437 MMBPD, thus equating to supply falling by just over 10 MMBBL.
Post the release of the DOE data, HO rose to a fresh high for the day while RB fell to its low for the day as the market clearly was impressed by the draw and demand seen in the distillate stats, while the weakness in the gasoline demand and a large build in gasoline inventories were disappointing, especially given that we are in the midst of the driving season.
Energy Market Technicals
Technically Crude oil & RB are having inside trading days versus yesterday's price range. Momentum is positive for the energies.
August WTI currently has a double top from yesterday/today at 67.58 / 67.50. Resistance above that is seen at 67.83 and then at 68.65-68.72. Support comes in at 66.15-66.21 and then at the recent lows at 64.50-64.51.

August RB support lies at 2.0930-2.0944 and then at 2.0795-2.0810. Resistance comes in at 2.1403-2.1419 and then at the 2.1600 area.

August ULSD has a double top at current from yesterday/today at 2.4205-2.4235. Resistance above that lies at 2.4524-2.4531. Support comes in at 2.3792-2.3809 and then at 2.3406-2.3418.

Natural Gas Market Overview
Natural Gas--NG is up 4.6 cents
NG futures are up further today as demand forecasts for the coming weeks have been raised. Support may also be coming from an EIA storage number today that is seen reducing the surplus to the 5 year average.
The EIA gas storage data is seen as a build of 47 to 53 BCF. This compares to last year's build of 35 BCF and the 5 year average build of 61 BCF.
LSEG raised their forecast for this week's demand by 1.1 cents from that seen Monday. This week's demand is seen at 106.1 BCF/d. Additionally, LSEG raised their Total Degree Days (TDD) for the coming 2 weeks. LSEG estimated 206 total degree days over the next two weeks, compared with 182 estimated on Tuesday. Normal for this time of year is 172 TDDs.
Financial firm LSEG said average gas output in the Lower 48 U.S. states has eased to 106.2 BCF/d so far in July, slightly down from 106.4 BCF/d in June.
Notable in Wednesday's option trading on the CME is the very large open interest increase in the September $3.75 call strike. The October $3.75 call also saw a large open interest increase. Trades were seen in both September and October of purchases of the $3.75 call versus the $4.75 call at a cost of 20.75 cents with delta sales in September at $3.56. The $4.75 open interest fell in both September and October, but by less than the $3.75 strike increases. Another notable trade was the purchase of the $3.75/$4.00 call spread for a cost of 7.1 cents. 6,000 contracts of this call spread traded. There was a large open interest increase in the August puts, notably in the $3.10, $3.00 and $2.75 strikes. The $3.00 August puts were bought at a cost of 5.6 cents with delta penultimate futures bought at $3.43. The $3.00 put was also sold against purchases of the $3.25 August put at a cost to the buyer of 7.4 cents. There were purchases seen in the December $10.00/$12.00 call spread, which traded 1.25 cents.
On the CME, in the TTF options, a trade in October was seen of purchases of the Euro 35 put versus selling of the Euro 30 put with delta futures buys at Euro 35. The recent heat wave that gripped much of Southern Europe is set to ease and wind generation is seen picking up. But, North Asia LNG prices edged higher amid renewed buying interest from importers, as per ANZ ban analysis. (seeking Alpha) Technically the attached chart of the nearby TTF futures shows momentum turning upward from a nearly oversold condition. Also the TTF futures chart shows a stepladder up look from the past 4 sessions.

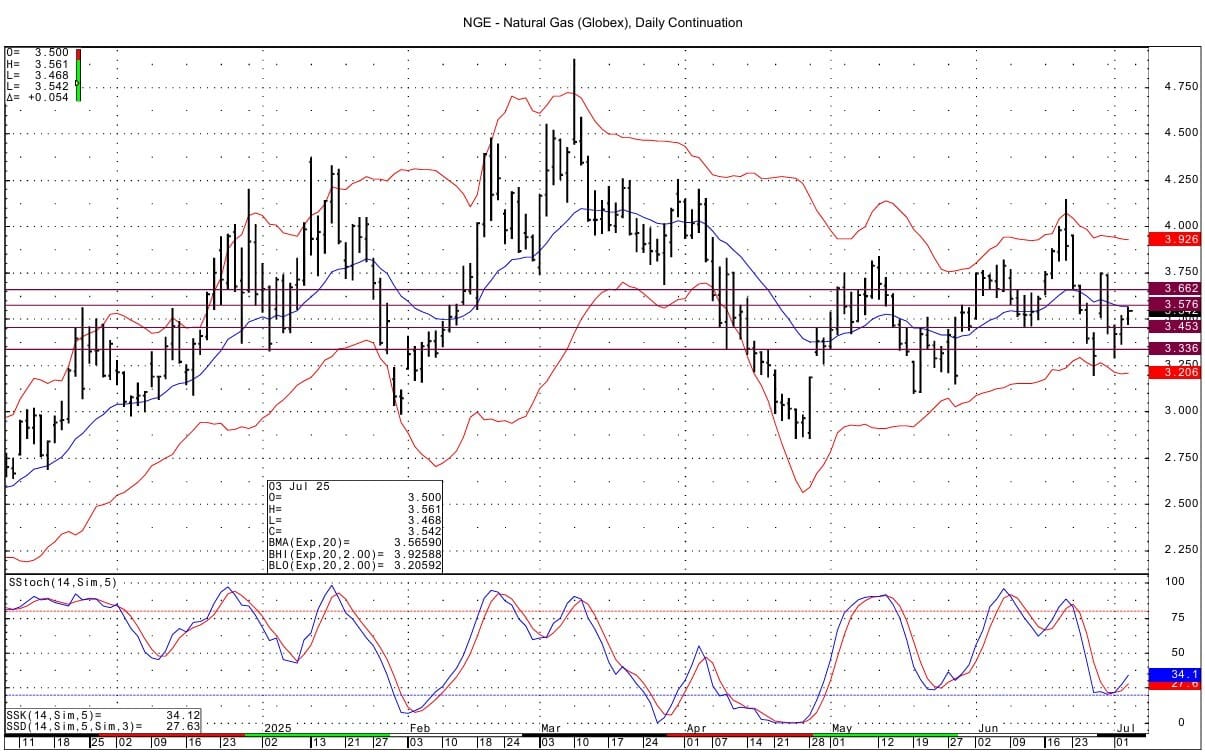
Technically NG spot futures have positive momentum basis the DC chart. The rally of the past 48 hours reinforces the notion of a market that is overall range bound. Resistance above is seen at 3.576 and then at 3.656-3.662. Support comes in at 3.454 and then at 3.335-3.340.
Enjoyed this article?
Subscribe to never miss an issue. Liquidity’s Daily Energy Market Updates provide a comprehensive analysis of both the fundamentals and technical factors driving energy markets.
Click below to view our other newsletters on our website:
Disclaimer
This article and its contents are provided for informational purposes only and are not intended as an offer or solicitation for the purchase or sale of any commodity, futures contract, option contract, or other transaction. Although any statements of fact have been obtained from and are based on sources that the Firm believes to be reliable, we do not guarantee their accuracy, and any such information may be incomplete or condensed.
Commodity trading involves risks, and you should fully understand those risks prior to trading. Liquidity Energy LLC and its affiliates assume no liability for the use of any information contained herein. Neither the information nor any opinion expressed shall be construed as an offer to buy or sell any futures or options on futures contracts. Information contained herein was obtained from sources believed to be reliable, but is not guaranteed as to its accuracy. Any opinions expressed herein are subject to change without notice, are that of the individual, and not necessarily the opinion of Liquidity Energy LLC
Reply