- Daily Energy Market Update
- Posts
- Daily Energy Market Update July 29,2025
WTI is up 47 cents September RB is up 1.98 cents September ULSD is down 0.14 cents
Liquidity’s Daily Market Overview
Crude oil prices are higher today boosted still by the EU trade deal and President Trump's supposed shorter deadline for Russia to accept a ceasefire with Ukraine. RB is also higher, but ULSD is lower. The sentiment for ULSD has soured a bit of late as the DOE data of the last 2 weeks has shown a very large increase in distillate supplies of over 7 MMBBL.
Oil prices were boosted Monday by news that had President Trump saying that he’d shorten his timeline for Russia to reach a truce with Ukraine. A time frame of 10-12 days was cited as the new timeline. The 50 day timeline the President had previously cited would have ended September 2nd. Trump has threatened sanctions on both Russia and buyers of its exports unless progress is made. (Reuters) The U.S. would possibly impose secondary tariffs of 100% on trading partners that import Russian oil. If imposed and enforced strictly, it would cause a significant shift in the oil outlook. India, China and Turkey have increased purchases of Russian crude since the Russia-Ukraine war, taking advantage of the discounts for the oil. For China, crude oil imports from Russia have averaged 1.99 MMBPD so far this year, or 17.5% of total crude imports. India has imported around 1.75 MMBPD of Russian crude oil so far this year (35% of total crude imports). Russia exports more than 7 MMBPD of crude oil and refined products. (ING)
""Pemex’s Crude Exports Fall to Lowest Since 1990"" reads a headline on Market news' feed today. Pemex’s crude exports fell to their lowest level since 1990 at 458 MBPD in June, meanwhile the government implements a financial bailout to help the state-owned company pay off its debt, Bloomberg reported. The 458 MBPD in exports for June is a monthly fall of 32% and an annual decline of 39%.
The OPEC+ Joint Ministerial Monitoring Committee, on Monday, stressed the need for full compliance with oil production agreements, ahead of Sunday's separate gathering of eight OPEC+ members to decide on increasing oil output for September. The JMMC asked countries that are not fully compliant to submit updated compensation plans by August 18. Iraq and Kazakhstan seem to be the main culprits of overproduction that are being called out by the JMMC. (Reuters)
On Monday, it seems that some of the upside for the energies was held in check by a strengthening U.S. dollar. The dollar climbed the most since May on the back of the U.S. / EU trade deal. The euro slid the most in over two months. (Reuters)
China's onshore crude oil stockpiles have reached a record high of 1.18 billion barrels. This surge is partly due to increased Iranian crude arrivals and a thaw in US-China relations, facilitating the flow of sanctioned barrels. The high stockpile levels provide a buffer against potential disruptions to Middle Eastern supplies, according to Bloomberg. While refiners are not currently concerned about supply issues due to the high stockpiles, some may reduce refinery runs if Iranian crude is permanently lost. New storage tanks and refinery openings, particularly in Shandong province, have facilitated the growth in stockpiles. Shandong province is a major hub for independent/teapot Chinese oil refineries.
Energy Market Technicals
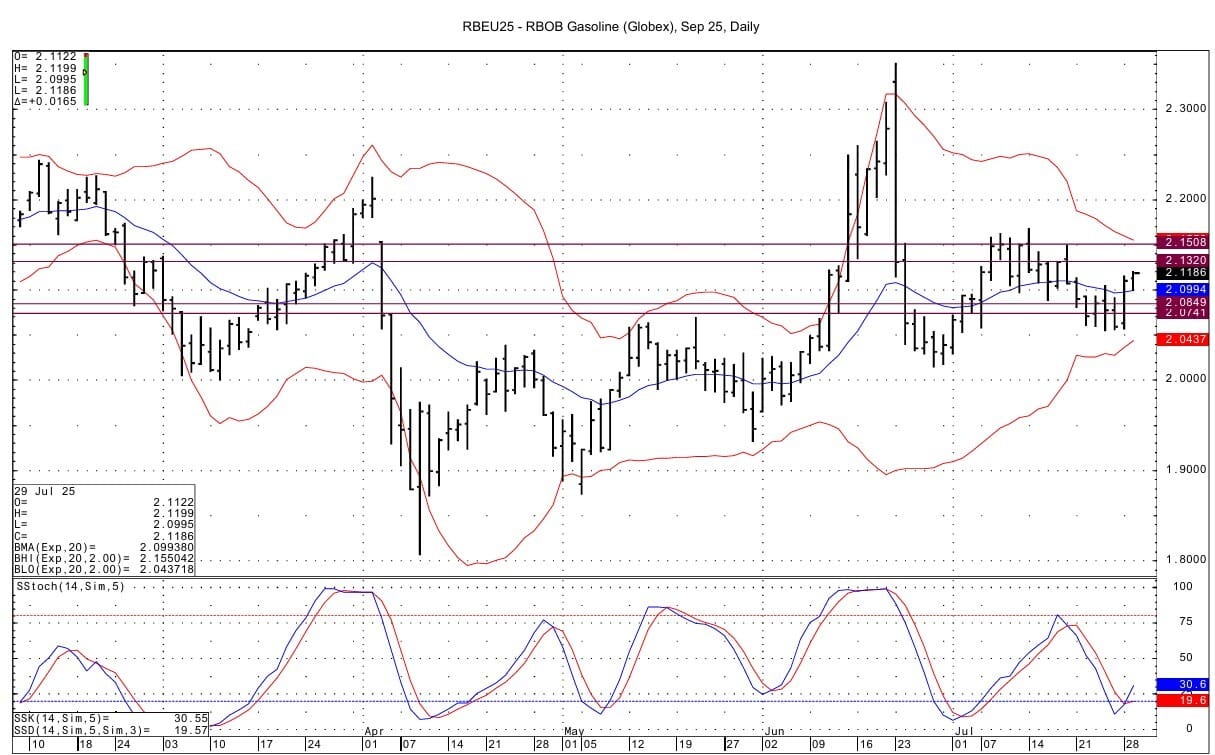
WTI and RB momentum have turned positive, but that for ULSD remains negative.
Overall, WTI still has a sideways look to the price range seen over the past month. Resistance is seen at 67.69-67.76 and then at 68.91-68.96. Support comes in at 66.12-66.15 and then at the prior 2 sessions' double bottom at 65.00-65.05.

September RB support lies at 2.0832-2.0849 and then at 2.0741-2.0753. Resistance is seen at 2.1308-2.1320 and then at 2.1501-2.1508.
ULSD for September sees support at 2.3576-2.3581 and resistance at the 2.4358 area.

Natural Gas Market Overview
Natural Gas-- September NG is up 7.8 cents
NG prices are higher today rebounding from a test of $3.00 yesterday in the expiring August futures. The rebound looks to be driven by a few factors: 1) an oversold technical condition (2) decent demand this week from the intense heat in the Eastern 1/2 of the U.S. (3) an uptick in LNG feed gas demand (4) worries over Russian oil & gas supply due to President Trumps' shortening of the deadline for Russia to accept a ceasefire (5) the psychological boost from the EU trade deal which has a clause for the EU to buy $750 billion of US LNG ( which is seen with a skeptical eye by many). Today's rally comes even as production remains robust.
On the back of the intense heat in the eastern half of the U.S., Celsius Energy projected Monday that the gas storage would see the first withdrawal of the season, albeit a 1 BCF withdrawal. Celsius projects that today Tuesday will see another withdrawal before cooler weather leads to further injections into storage.
U.S. domestic natural gas production was estimated at a record high of 109.66 BCF/d yesterday compared to the previous 30 day average around 108 BCF/d, according to data from Bloomberg. Reuters reports that July average NG production so far has been 107.4 BCF/d, up from June's record amount of 106.4 BCF/d. On July 9, the average for July NG production was 106.7 BCF/d.
Total feedgas flows to US LNG export terminals are today estimated up 0.902 BCF/d at 15.26 BCF/d. Reuters reported Friday that the average amount of gas flowing to the eight big U.S. LNG export plants has risen to 15.7 BCF/d so far in July, up from 14.3 BCF/d in June but still below the monthly record high of 16.0 BCF/d in April.
Today is the last trading day for the August NG futures.
Despite a period of relative calm in the TTF gas market, upside risks remain which could tighten European supply from the end of August onwards, as per Rabobank commentary. The EU's new trade deal with the United States helped lift faltering natural gas prices on the continent as the week got underway, despite broader questions over its viability. Analysts say the bloc has virtually no chance of meeting the $750 billion amount for LNG imports from the U.S. Additionally the shorter deadline proposed by President Trump for Russia to agree to a ceasefire with Ukraine is seen supporting European natural gas prices. The spot TTF futures price fell last week to its lowest value since May 2nd. According to Commerzbank, cooling Middle East tensions and increased imports helped drag prices lower. Technically as the August TTF contract is set to expire tomorrow, the DC chart for TTF futures is showing momentum that has turned positive from a near oversold condition. There is a double bottom basis the DC chart from the prior 2 sessions at Euro 31.905/31.985. Resistance lies at the recent high at Euro 36.320.

The September $4.50 call saw an open interest increase of over 4,000 contracts in Monday's activity on the CME. One notable trade for the September $4.50 call saw it sold two times versus the purchase of one September $4.00 call at a cost of 0.4 cents to the buyer of the $4.00 call. Another notable trade seen Monday on the CME saw the -$0.70 call bought versus selling of the -$2.00 put in the October January calendar spread options. The cost to the call buyer was 0.3 cents. Open interest data from the CME for the October January calendar spread options shows that the -$.70 call was being closed out, while the -$2.00 put was an initiating trade.
The September NG futures fell yesterday to their lowest daily value since Nov 8,2024. In so doing, they have a mean reversion set up from Monday's close below the lower bollinger band on the daily chart. That band today lies at 3.037. Momentum is still negative, but near oversold and looks poised to turn positive if the rally seen today holds and even extends in the next day or so. Support for the September NG lies at yesterday's low at 3.061 and then at 3.015-3.021. Resistance is seen at 3.207-3.211 and then at 3.290-2.299.

Enjoyed this article?
Subscribe to never miss an issue. Liquidity’s Daily Energy Market Updates provide a comprehensive analysis of both the fundamentals and technical factors driving energy markets.
Click below to view our other newsletters on our website:
Disclaimer
This article and its contents are provided for informational purposes only and are not intended as an offer or solicitation for the purchase or sale of any commodity, futures contract, option contract, or other transaction. Although any statements of fact have been obtained from and are based on sources that the Firm believes to be reliable, we do not guarantee their accuracy, and any such information may be incomplete or condensed.
Commodity trading involves risks, and you should fully understand those risks prior to trading. Liquidity Energy LLC and its affiliates assume no liability for the use of any information contained herein. Neither the information nor any opinion expressed shall be construed as an offer to buy or sell any futures or options on futures contracts. Information contained herein was obtained from sources believed to be reliable, but is not guaranteed as to its accuracy. Any opinions expressed herein are subject to change without notice, are that of the individual, and not necessarily the opinion of Liquidity Energy LLC
Reply