- Daily Energy Market Update
- Posts
- Daily Energy Market Update January 7,2026
July 25, 2026
WTI is down 16 cents at $56.97 RB is up 1.86 cents at $1.7192 ULSD is up 1.04 cents at $2.0934
Liquidity’s Daily Market Overview
Energies are lower, but well off their overnight lows having been pressured by news from President Trump of an agreement for Venezuela to send 50 MMBBL of oil to the US. Also weighing on prices was the disappointing product inventories seen in the API data.
Venezuela will be "turning over" between 30 million and 50 million barrels of "sanctioned oil" to the U.S., Trump wrote in a social media post on Tuesday. Venezuela has millions of barrels of oil loaded on tankers and in storage tanks that it has been unable to ship since mid-December due to a blockade on exports imposed by Trump. (WSJ/Reuters) Today news headlines from Bloomberg quote the US Energy Secretary as saying that the oil will be sold into the global market, but he added that he wants the US government to sell the oil to US refiners. He also sees Venezuelan oil production "growing by several hundred thousand barrels in the short to mid-term." (Reuters)
The rebound off the overnight lows may be a result of "market participants seeming to believe now that those volumes could be smaller,", as per UBS' analyst. Another analyst added :" the prospect of higher, cheaply extracted Venezuelan oil exports could pause expansion of productive capacity in the U.S. and elsewhere." His opinion is that oil prices can rise due to the pause on production in some regions.
The decision by President Trump to import Venezuelan oil is said to have angered Chinese oil buyers as the crude bound for China is being re-routed. Beijing, which imported 389 MBPD of Venezuelan oil in 2025, representing about 4% of its seaborne crude imports, may now turn more to Iran and Russia, traders said. (Reuters) Venezuela must agree to partner exclusively with the US on oil production, thus expelling Russia and China from Venezuelan oil trade, as per Quantum Commodities commentary.
API Forecast Actual
Crude Oil +0.5/-1.33 -2.8
Gasoline +2.8/+3.5 +4.4
Distillates +0.2/+2.1 +4.9
Cushing n/av +0.7
Runs -0.3/+0.3% n/av
Yesterday, the EIA issued its weekly fuel price update. The national retail gasoline price fell to $2.796, down 1.5 cents on the week. This week's gasoline price is the lowest seen since March 8, 2021. The retail diesel price fell by 2.3 cents on the week to $3.477.
Energy Market Technicals
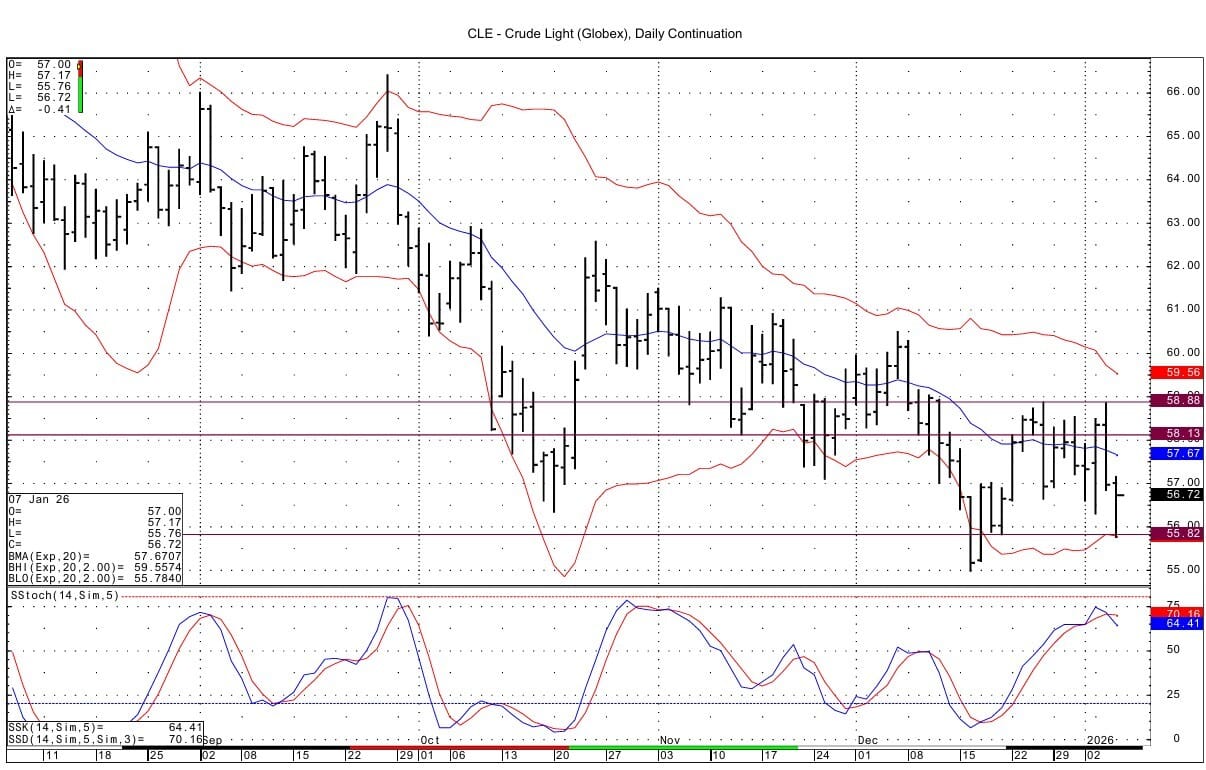
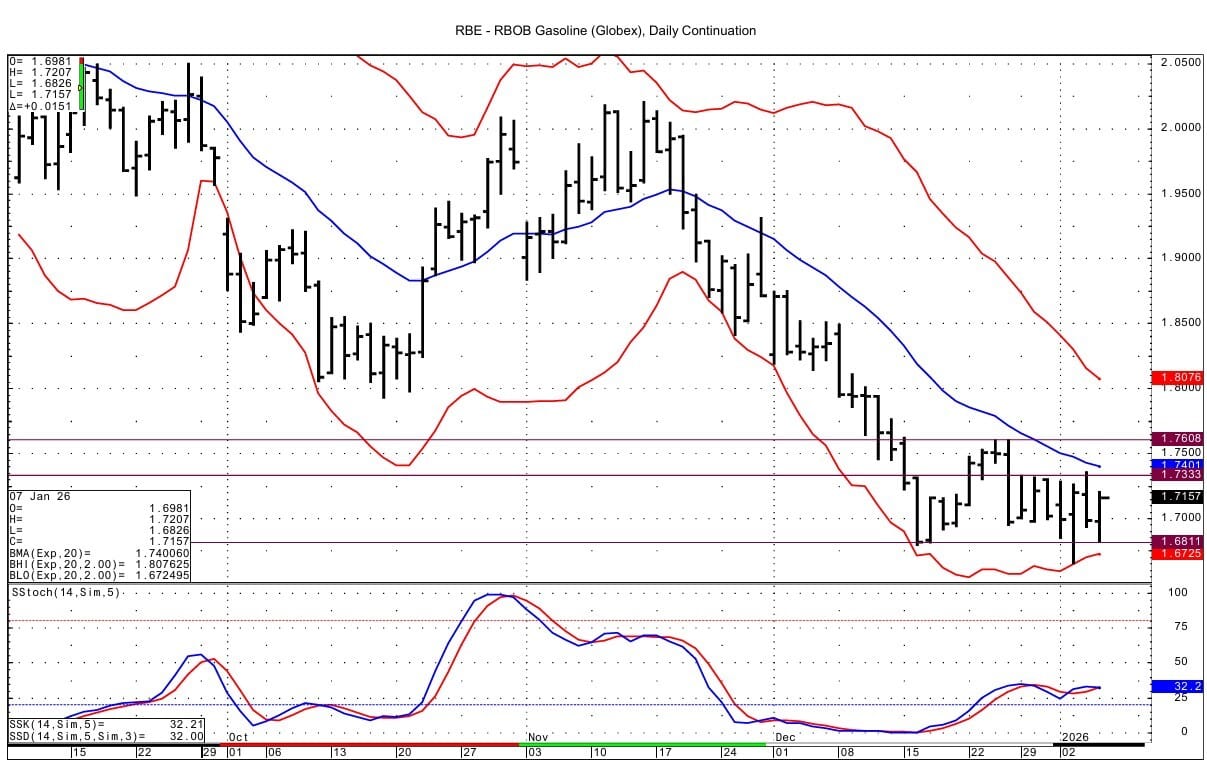
Momentum has turned negative for the crude oil and distillates with the price drop seen the past 2 days. RB DC chart based momentum is neutral.
Technically the WTI spot futures tested the lower bollinger band on the DC chart. That band lies at 55.80. The overnight low is 55.76, which tested support at 55.82-55.88. Resistance comes in at 58.13-58.18.
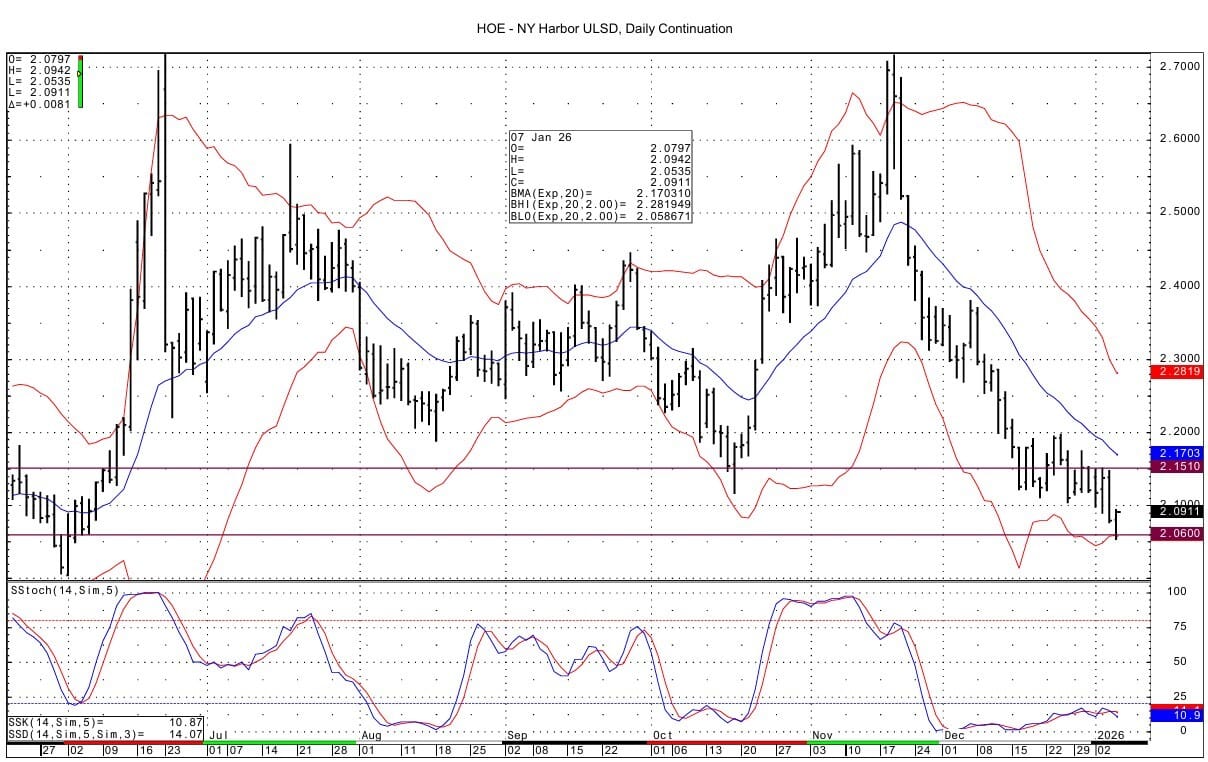
The spot ULSD contract also tested its DC chart lower bollinger band, which lies at 2.0586. Support at 2.0600-2.0606 was tested with the overnight low of 2.0535. Resistance lies at 2.1496-2.1510.
RB spot futures see support at 1.6795-1.6811. Resistance comes in at 1.7312-1.7333.
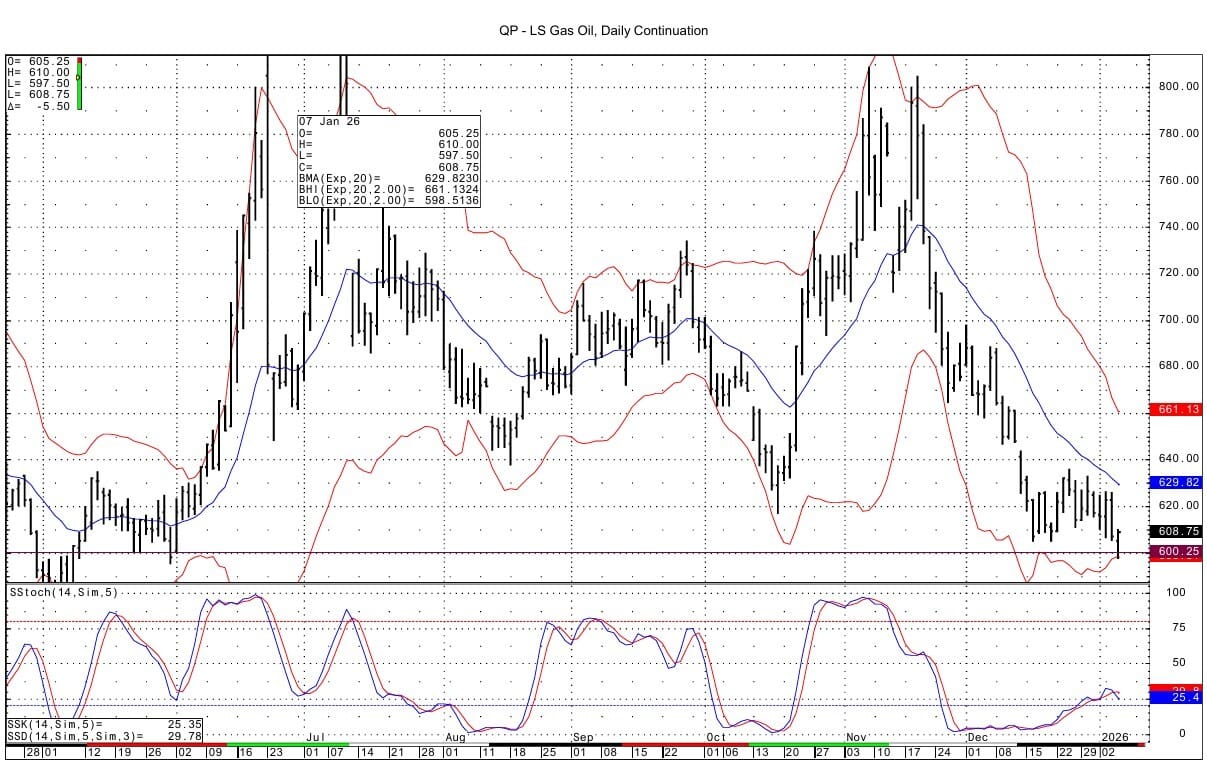
The Gasoil spot futures also tested the DC chart lower bollinger band overnight. That band lies at 598.50. The overnight low is 597.50. Support is seen above that at the 600.00 area. Resistance comes in at the prior 2 days highs at the 626 area.
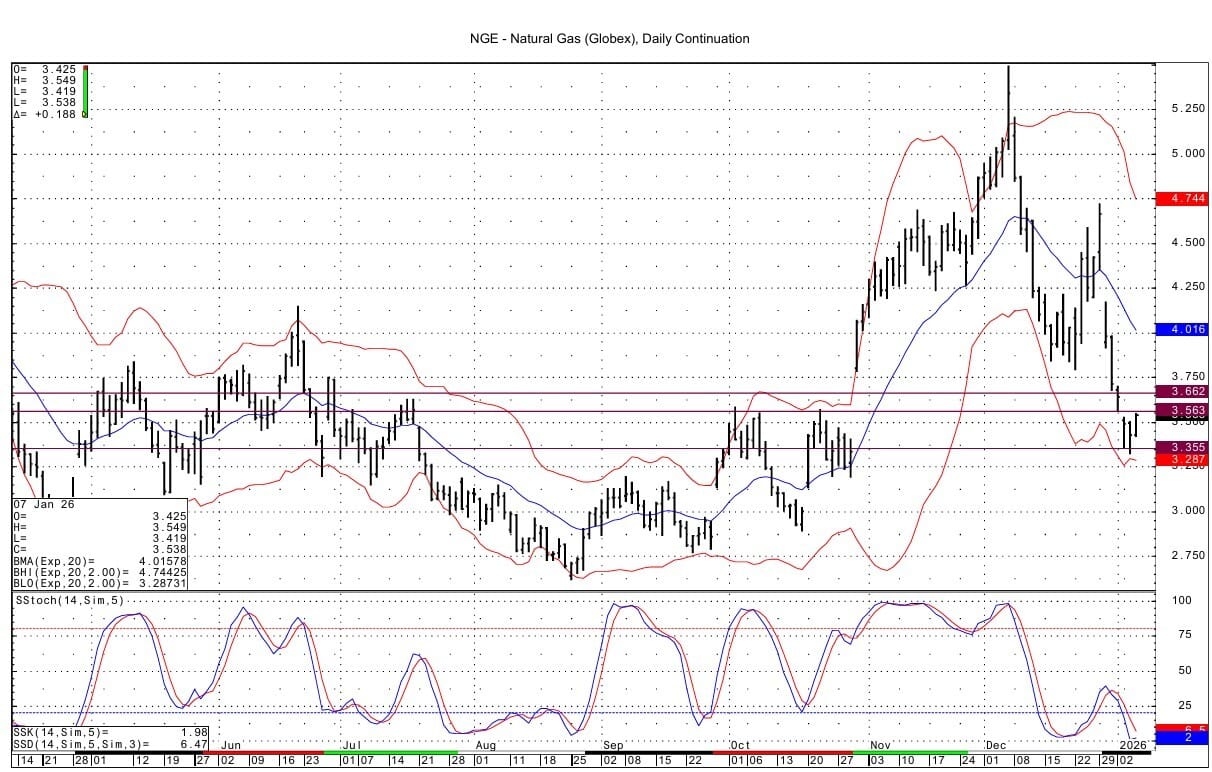
Natural Gas Market Overview
Natural Gas--NG is up 14.5 cents at $3.495
NG futures are up strongly after settling lower yesterday for the 5th straight session. The back end of the 14 day period is showing very cold weather entering the forecast for the northern half of the US. NGI says that weather models added a small amount of HDD demand to the forecast overnight.
The European TTF price has gapped higher today. The gap created today on the spot TTF futures goes from 28.180 to 28.260. Today's price has risen to the best value in almost 6 weeks. European gas storage has now fallen below 60%, well below the 5-year average of 73% full. (ING) Technically on the DC chart, there are further gaps to fill above 30 Euros. Those gaps lie from 30.215 to 30.255 and then from 30.840 to 30.855. Support below the market is seen at the Euro 26.90 area.
Technically the NG spot futures traded up today into the gap created over the weekend. The gap goes up to 3.563. Momentum is near oversold basis the DC chart and looks poised to turn upward within a day or so if the market settles in the upper 3.40's or higher. Support for the NG spot futures lies at 3.355-3.357. Resistance above the gap area at 3.563 comes in at 3.656-3.662. Several comments seen cited that the market was oversold/overextended prior to today.
Enjoyed this article?
Subscribe to never miss an issue. Liquidity’s Daily Energy Market Updates provide a comprehensive analysis of both the fundamentals and technical factors driving energy markets.
Click below to view our other newsletters on our website:
Disclaimer
This article and its contents are provided for informational purposes only and are not intended as an offer or solicitation for the purchase or sale of any commodity, futures contract, option contract, or other transaction. Although any statements of fact have been obtained from and are based on sources that the Firm believes to be reliable, we do not guarantee their accuracy, and any such information may be incomplete or condensed.
Commodity trading involves risks, and you should fully understand those risks prior to trading. Liquidity Energy LLC and its affiliates assume no liability for the use of any information contained herein. Neither the information nor any opinion expressed shall be construed as an offer to buy or sell any futures or options on futures contracts. Information contained herein was obtained from sources believed to be reliable, but is not guaranteed as to its accuracy. Any opinions expressed herein are subject to change without notice, are that of the individual, and not necessarily the opinion of Liquidity Energy LLC
Reply