- Daily Energy Market Update
- Posts
- Daily Energy Market Update January 28,2026
June 19, 2026
WTI is up 96 cents at $63.35 March RB is up 2.28 cents at $1.9054 March ULSD is up 4.00 cents at 2.4506
Liquidity’s Daily Market Overview
Energies are higher this morning boosted by a weak dollar, lingering effects of the US storm from the weekend and the Kazakh production losses, as well as some concerns about rising Mideast tension.
Kazakhstan is hoping to bring back their production gradually within a week. Sources, however, have said this might take longer. As of Monday, a force majeure on CPC blend exports was still in effect. One source said that the fields produced only about 60 MBPD, only about 6% of its usual levels, as of Monday's reporting. (Reuters)
The US dollar index has fallen today to its lowest value since April 2022. President Trump indicated he’s comfortable with the dollar’s recent decline. (Bloomberg)
Iran has restricted airspace and declared a hazard zone near the Strait of Hormuz for live-fire military drills from January 27–29, 2026, amid heightened regional tensions. Iran on Tuesday issued a Notice to Airmen (NOTAM), warning of live-fire military activity in the airspace along the Strait of Hormuz. The US military has also announced a major multi-day exercise in the Middle East, sharply raising tensions after weeks of unrest inside Iran. (Reuters/AFP)
API Forecast Actual
Crude Oil +0.24/+1.8 -0.247
Gasoline +1.0/+2.52 -0.415
Distillate -0.48/-1.5 +2.0
Cushing n/av -0.092
Runs -0.3/-0.6% n/av
An article published Tuesday in Bloomberg noted that U.S. diesel prices have blown out to a premium over look-alike products in Europe that translate to about 40 cts/g, which it said was the widest in about three years. Quantum Commodities wrote Tuesday that: Strained US diesel balances could pull European barrels from across the Atlantic for the first time in a year this month.
Energy Market Technicals
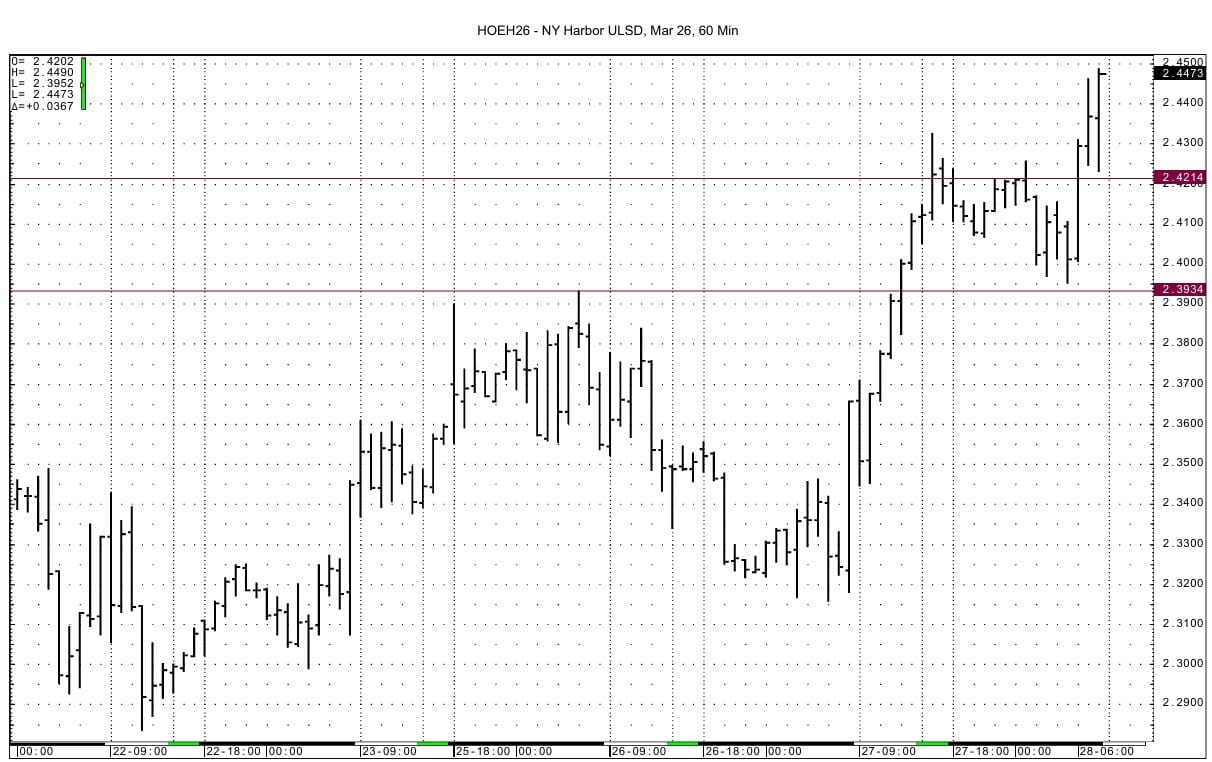
Energy prices today are at their best in the past 2 months for the products and in almost 4 months for the crude oils. WTI DC chart based momentum remains positive. ULSD March daily chart momentum is neutral at an overbought level. RB March chart momentum looks to be cresting.
WTI spot futures see support at 62.03-62.05, which is just below the overnight low of 62.07. Below that support is seen at 61.21-61.25. Resistance comes in at 63.65-63.67 and then at 64.76.

March ULSD sees resistance at 2.4942, which is the high from mid-November. Support lies at 2.4120-2.4214 and then at the overnight low at 2.3934-2.3952.

March RB support is seen at 1.8743-1.8756. Resistance comes in at 1.9211-1.9222 and then at 1.9370.

Natural Gas Market Overview
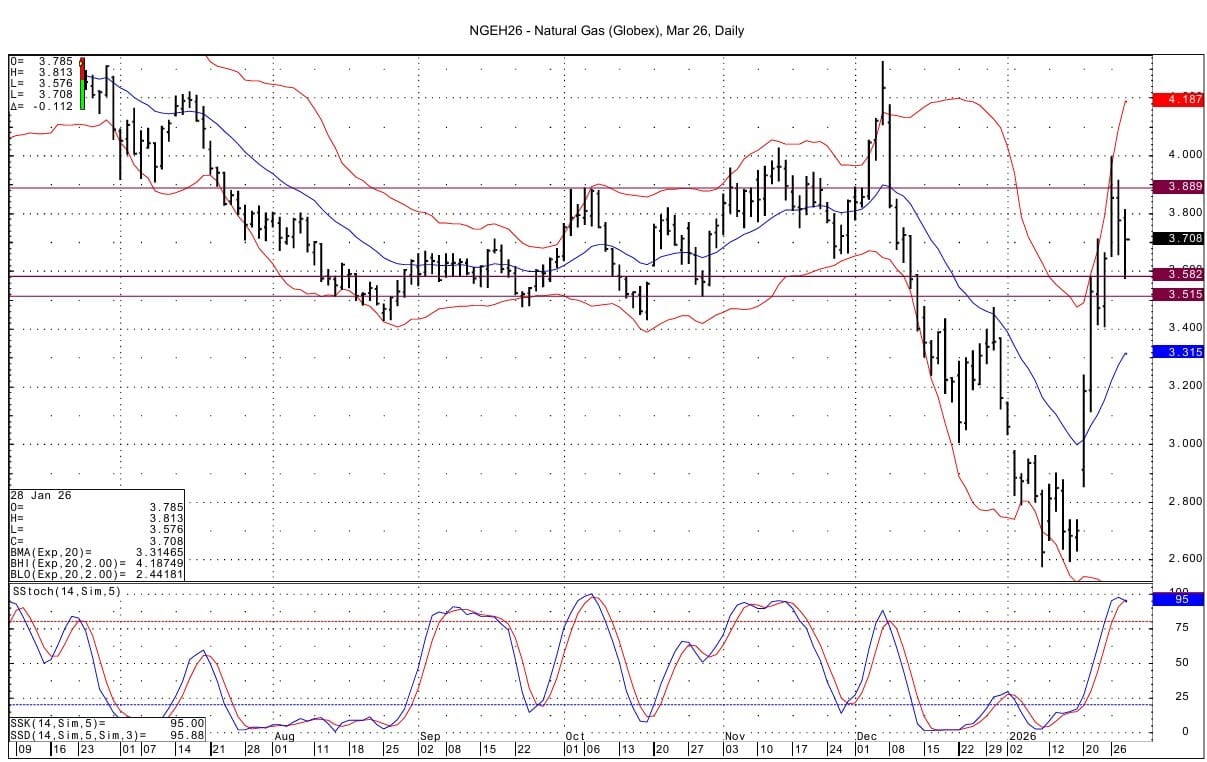
Natural Gas--March NG is down 9.6 cents at $3.724
The March NG futures are lower as the fundamentals are seen moderating slightly next week and some profit taking is likely occurring. Weather forecasts have dialed back some demand today.
The American weather model is giving back a sizable amount of HDD today as per the forecast issued overnight.
Today is the last trading session for the February NG futures contract. There is a very small amount of open positions as of the close Tuesday; this is evidenced in the fact that today's volume for the expiring February contract is extremely low.
One comment seen underscores some of the reasoning for the sharp rally seen the past week or so :""The market is trying to sort out how much of this rally was weather fear versus how much is a true reminder that storage alone does not solve deliverability when pipelines, wellheads, and processing plants are operating in extreme conditions."
The next day Henry Hub cash price yesterday eased slightly from the day before. In early morning trading the next day cash was quoted $22.00/$26.00, down from the prior day's quote of $25.00/$28.00. This reflects the heightened demand along certain pipelines and the limited infrastructure to move the desired amounts of gas. NGI's national spot gas average fell by $28.895 to $18.870 on Tuesday.
Notable options trades seen Tuesday were mainly in the Calendar Spread Options (CSO's). The October January minus $2.00 put traded between 2.5 and 2.8 cents in an opening position. Additionally, in the October January CSO 6,000 lots of the minus 75 cent calls went 6.2 cents and 2,500 lots went 5.8 cents. The October January minus 65 cent call CSO traded 4.2 cents. Both the -75 and -65 cent call trades were closing positions. In the October January CSO, the -$1.00/-$1.50/-$2.00 put butterfly traded 5.2 cents. The October January futures spread settled at -$1.019 Tuesday. In the March April CSO, the 25/50/75 cent butterfly traded 2.8 cents. Another butterfly traded in the March April CSO. The flat/25/50 cents butterfly traded 3.0 cents. The March April futures spread settled at 15.0 cents. The April October -10/-20 cent call spread CSO traded 2.0 cents. This was an opening position. The April October futures spread settled at -41.1 cents. The April October 2026 strip saw the $2.00 puts trade 1.3 cents with 0.03 delta futures buys at $3.83.
Technically the March NG futures' momentum looks to be cresting. Support for the March futures comes in at 3.581-3.585, which was tested overnight with a low of 3.576. Below that support comes in at 3.509-3.515. Resistance above lies at 3.882-3.889.
Enjoyed this article?
Subscribe to never miss an issue. Liquidity’s Daily Energy Market Updates provide a comprehensive analysis of both the fundamentals and technical factors driving energy markets.
Click below to view our other newsletters on our website:
Disclaimer
This article and its contents are provided for informational purposes only and are not intended as an offer or solicitation for the purchase or sale of any commodity, futures contract, option contract, or other transaction. Although any statements of fact have been obtained from and are based on sources that the Firm believes to be reliable, we do not guarantee their accuracy, and any such information may be incomplete or condensed.
Commodity trading involves risks, and you should fully understand those risks prior to trading. Liquidity Energy LLC and its affiliates assume no liability for the use of any information contained herein. Neither the information nor any opinion expressed shall be construed as an offer to buy or sell any futures or options on futures contracts. Information contained herein was obtained from sources believed to be reliable, but is not guaranteed as to its accuracy. Any opinions expressed herein are subject to change without notice, are that of the individual, and not necessarily the opinion of Liquidity Energy LLC
Reply