- Daily Energy Market Update
- Posts
- Daily Energy Market Update January 22, 2026
March WTI is down 1.09 at $59.56 March RB is down 3.06 at $1.8498 March ULSD is down 3.98 at $2.3188.
Liquidity’s Daily Market Overview
Energies are trading lower this morning, with crude and ULSD under pressure as the market refocuses on oversupply concerns and the likelihood of a build in U.S. crude inventories. Recent strength tied to extreme cold forecasts and distillate demand is being offset by softer crude sentiment, with the HO/CL crack narrowing modestly after widening sharply earlier in the week.
Oil prices weakened early Thursday as expectations for rising U.S. crude and gasoline stockpiles outweighed support from the ongoing—but temporary—production shutdowns at Kazakhstan’s Tengiz and Korolev fields. Traders continue to view the outages as short-lived, limiting their impact on near-term balances, while broader supply growth and inventory builds remain the dominant theme.
Some of the recent geopolitical tension that lifted crude has begun to discount quickly. Reports of easing US–Europe tariff fears and reduced fear of broader conflict in key regions have taken some risk premium out of the market, prompting traders to step back from the bullish positions that had driven crude prices higher earlier this week.
The American Petroleum Institute is scheduled to release weekly inventory data later today, with figures from the Energy Information Administration also on deck. A preliminary Reuters poll indicates U.S. crude and gasoline inventories likely rose last week, while distillate stocks are expected to decline.
Energy Market Technicals
The March WTI is having an inside day today. Support comes in at 58.57 (Tuesday’s low and the 20 day moving average. Resistance comes in at 61.63 (upper Bollinger Band) and then 62.20 (last week’s high).

March Crude
March RBOB is also having an inside day. Resistance comes in at 1.8894 and support around 1.7900-1.8000 where we have the low from Tuesday and last week. This level also lines up with the 20 day moving average.
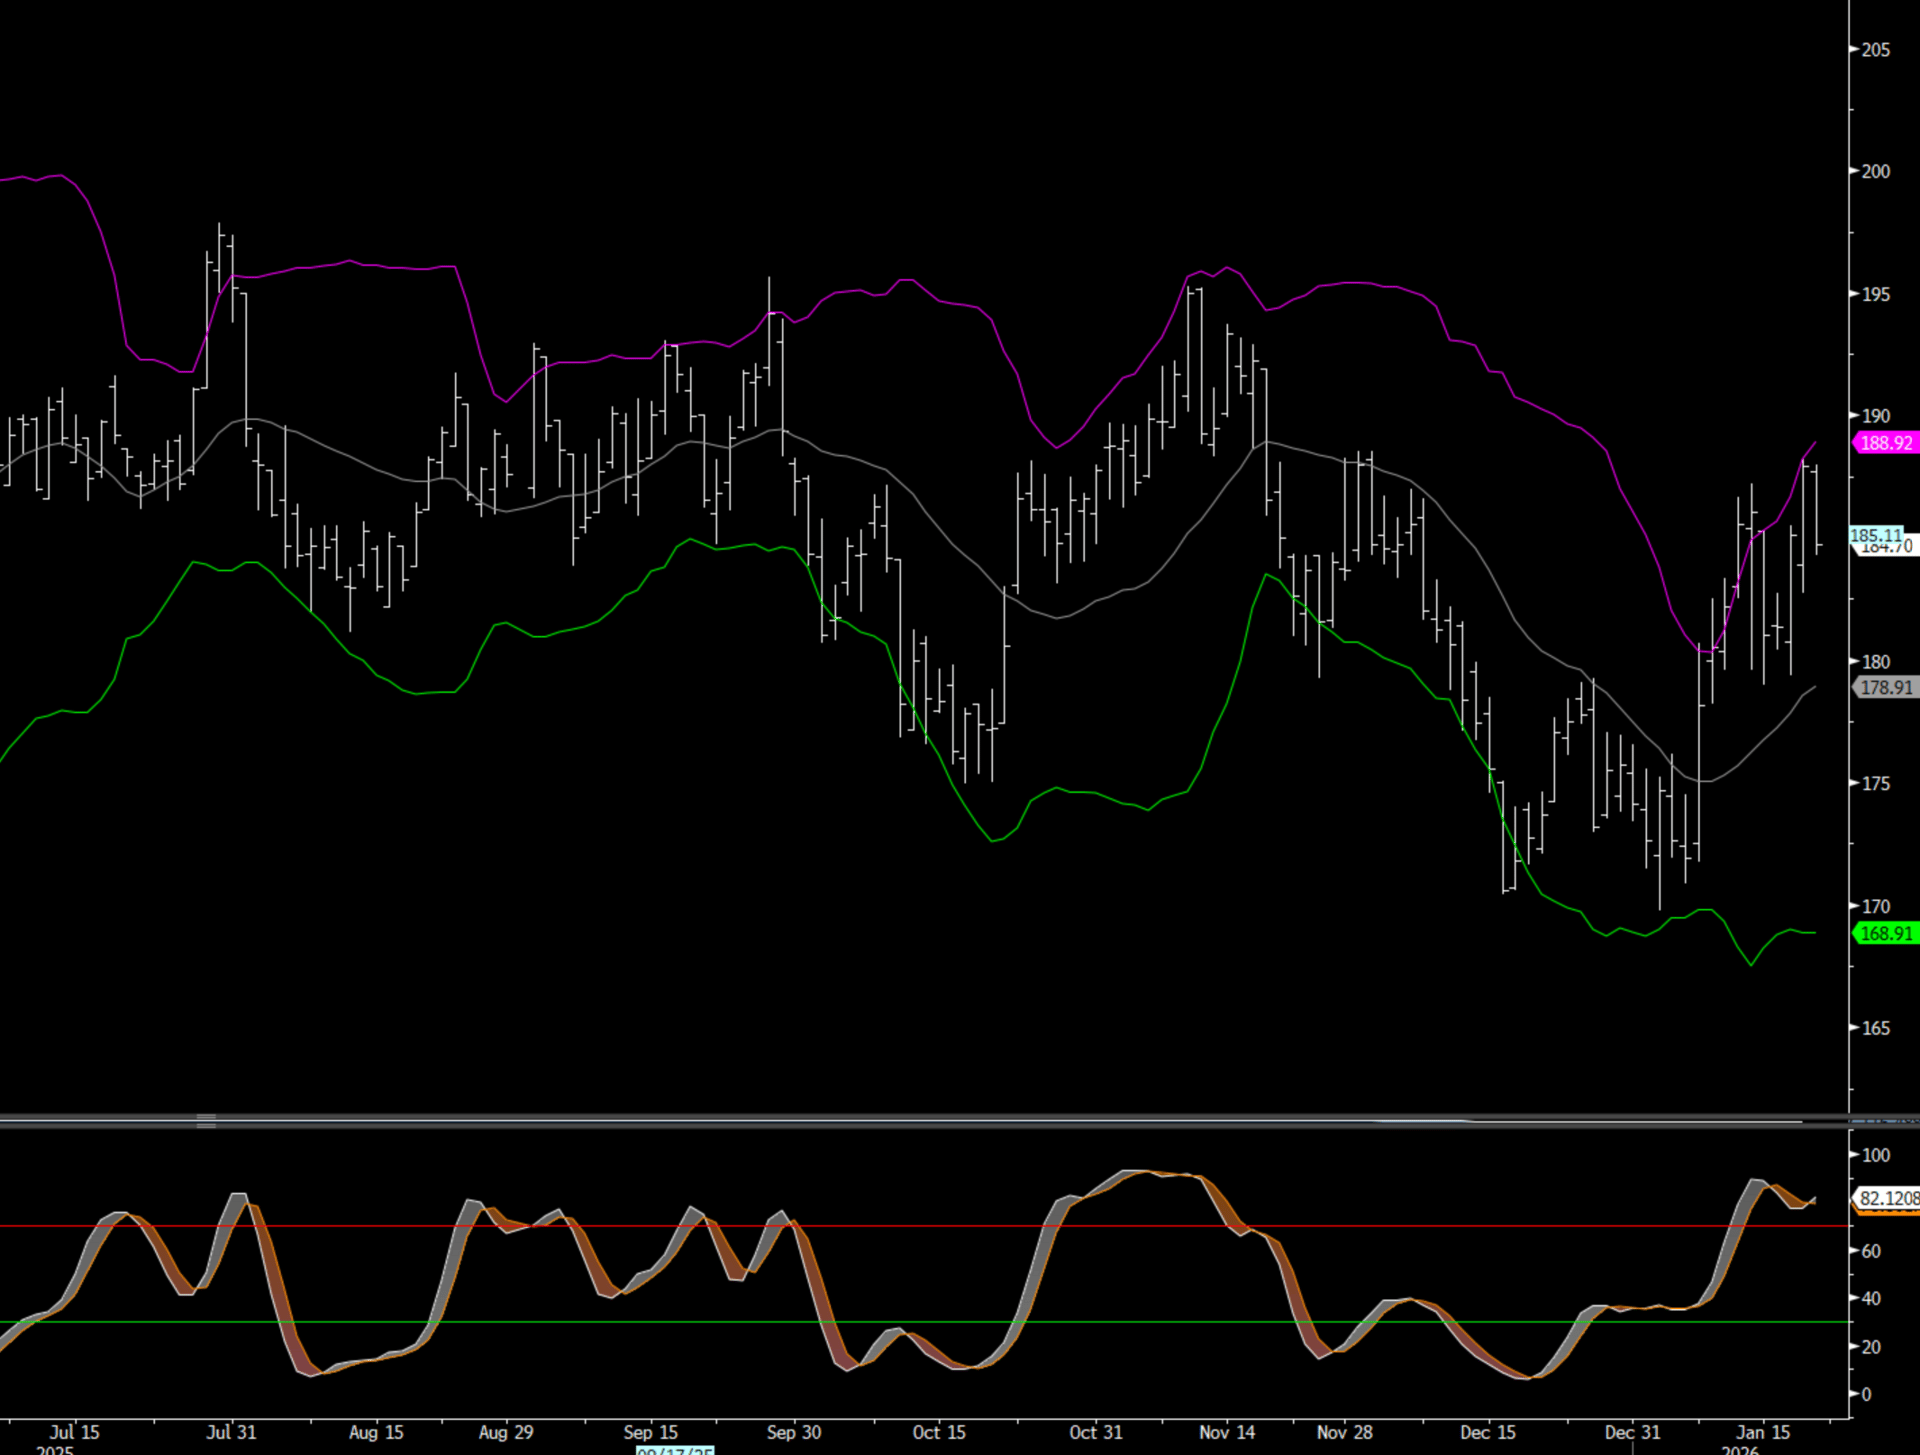
March RBOB
March ULSD is trading back inside the Bollinger Bands today after closing above yesterday.There’s bearish confluence with the reversal today back inside the bands as well as bearish divergence on the high yesterday.
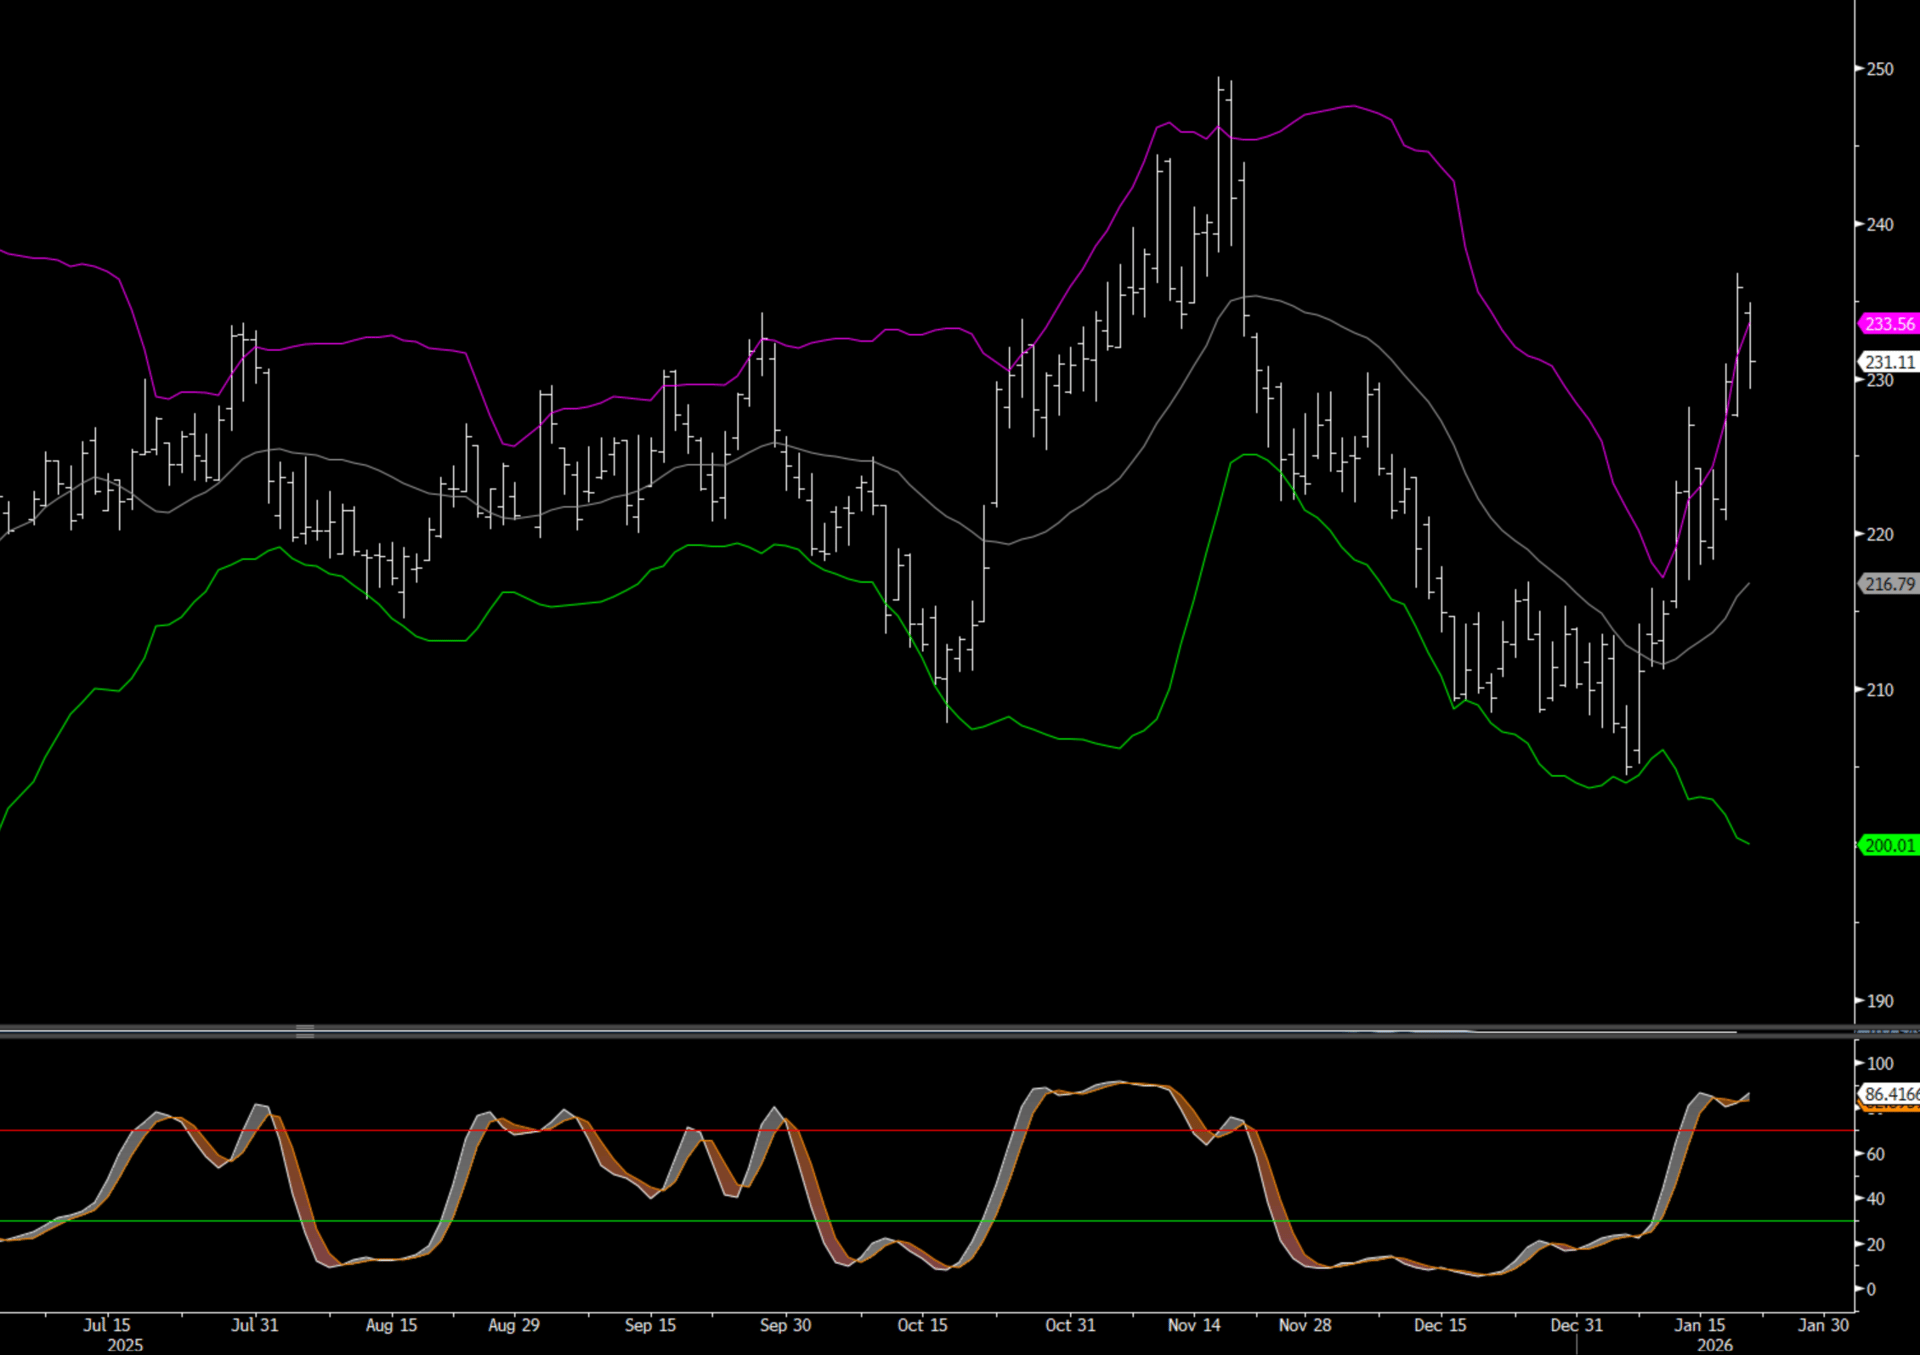
March ULSD
Natural Gas Market Overview
Feb Nat Gas is up .60 (7:06 am) printing a high of 5.57.
Natural gas futures are sharply higher again this morning as an intense Arctic blast grips much of the U.S. Winter weather models show average temperatures remaining well below normal through late January and into early February, which is fueling expectations for very strong heating demand and tightening near-term balances. Traders are increasingly pricing in the risk of freeze-offs that could temporarily reduce production, especially in regions less hardened to extreme cold, adding to bullish sentiment. Over the past few sessions, U.S. Henry Hub futures have risen over 60%, reaching the highest levels since late 2022, as sub-freezing conditions spread across the Midwest, Northeast and parts of the South.
The rally has been amplified by short covering as positioning began the week with bearish bias before weather forecasts shifted dramatically colder. This combination of surging heating demand expectations and potential supply risk from freezing conditions has led to one of the strongest multi-day advances in recent market history. Front-month contracts are on track for a significant weekly gain, underscoring the market’s repricing of winter risk.
Looking beyond immediate weather drivers, traders are also watching structural supply/demand factors. While the extreme cold continues to dominate the front end of the curve, strong LNG export flows and historically high feed gas demand remain part of the broader fundamental backdrop supporting prices through the winter. Any future NOAA or EIA storage data that shows deeper than expected withdrawals could reinforce the bullish thesis and extend this run.

Enjoyed this article?
Subscribe to never miss an issue. Liquidity’s Daily Energy Market Updates provide a comprehensive analysis of both the fundamentals and technical factors driving energy markets.
Click below to view our other newsletters on our website:
Disclaimer
This article and its contents are provided for informational purposes only and are not intended as an offer or solicitation for the purchase or sale of any commodity, futures contract, option contract, or other transaction. Although any statements of fact have been obtained from and are based on sources that the Firm believes to be reliable, we do not guarantee their accuracy, and any such information may be incomplete or condensed.
Commodity trading involves risks, and you should fully understand those risks prior to trading. Liquidity Energy LLC and its affiliates assume no liability for the use of any information contained herein. Neither the information nor any opinion expressed shall be construed as an offer to buy or sell any futures or options on futures contracts. Information contained herein was obtained from sources believed to be reliable, but is not guaranteed as to its accuracy. Any opinions expressed herein are subject to change without notice, are that of the individual, and not necessarily the opinion of Liquidity Energy LLC
Reply