- Daily Energy Market Update
- Posts
- Daily Energy Market Update January 21,2026
March WTI is up 5 cents at $60.40 March RB is up 0.90 cents at $1.8609 March ULSD is up 4.57 cents at $2.3434
Liquidity’s Daily Market Overview
Energies are higher --led by the ULSD contract as extreme cold is forecast for the US in the coming 2 weeks --the HO/CL crack for March is wider today by almost $2 - Oil prices are supported by the IEA having raised their global oil demand forecast for 2026 by 70 MBPD - while keeping their total oil supply growth forecast unchanged overall
Oil prices fell early, but have recovered, on Wednesday as expectations of a build in U.S. crude inventories outweighed a temporary shutdown at two large fields in Kazakhstan and fresh geopolitical tension tied to U.S. threats of tariffs over its bid to gain control of Greenland. Oil production at the two Kazakh fields could be halted for another seven to 10 days, three industry sources told Reuters.
The oil output halt at Tengiz, one of the world's largest oilfields, and Korolev is temporary, and downward pressure from an expected rise in U.S. crude inventories along with geopolitical tension will persist, IG market analyst Tony Sycamore said on Wednesday.
The American Petroleum Institute weekly inventory data is due at 4:30 p.m. EST (2130 GMT) today, and figures from the Energy Information Administration, the statistical arm of the U.S. Department of Energy, are due at 12 p.m. EST (1700 GMT) on Thursday, both a day later due to a U.S. federal holiday on Monday.
U.S. President Donald Trump said on Tuesday there was "no going back" on his goal to control Greenland. Last week he vowed to implement a wave of increasing tariffs on European allies until the U.S. is allowed to buy the Arctic island.
U.S. crude oil and gasoline stockpiles were expected to have risen last week, while distillate inventories likely fell, a preliminary Reuters poll showed on Tuesday.
Energy Market Technicals
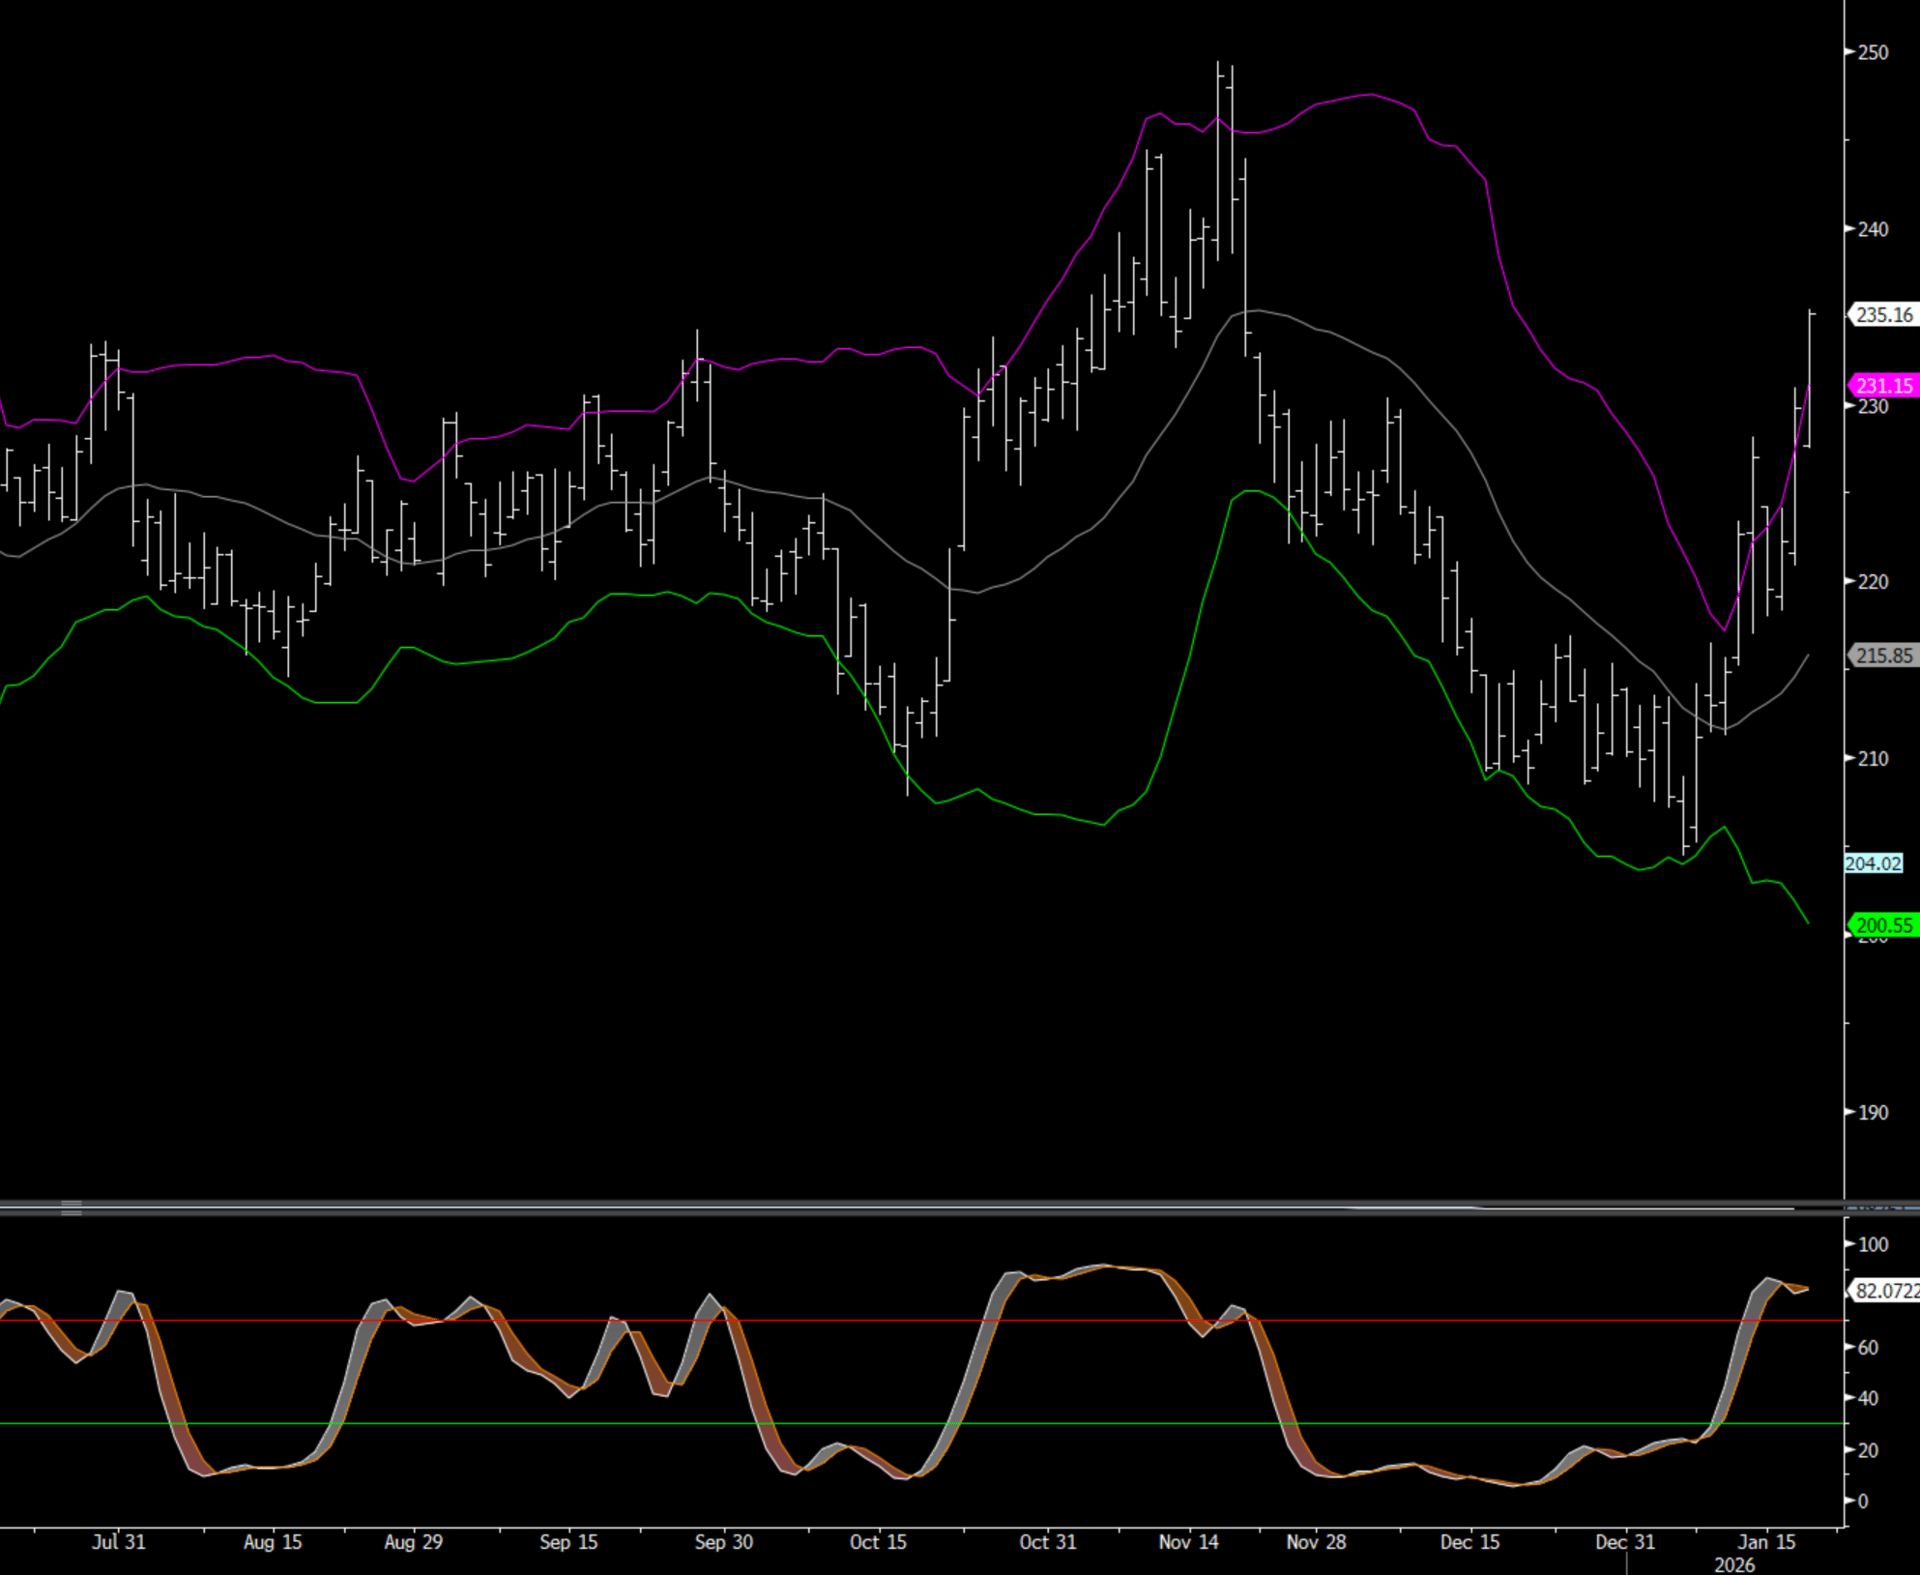
The March WTI had a bullish key reversal yesterday but there hasn’t been strong follow through. Stochastic momentum is in overbought territory and pointing lower. Resistance comes in at 61.50 (upper Bollinger Band) and then last weeks high of 62.20. Support comes in at yesterday’s low 58.53 and then the 20 day moving average at 58.47

WTI March 26
March RBOB resistance comes in at 1.8784 and support at 1.7845. RBOB also had a bullish key reversal yesterday.

RBOB March 26U
March ULSD is trading above the upper Bollinger Band (2.3106). Next significant resistance doesn’t come until the double top from November above 2.4915/2.4942. The closest support would be yesterday’s low at 2.2088.
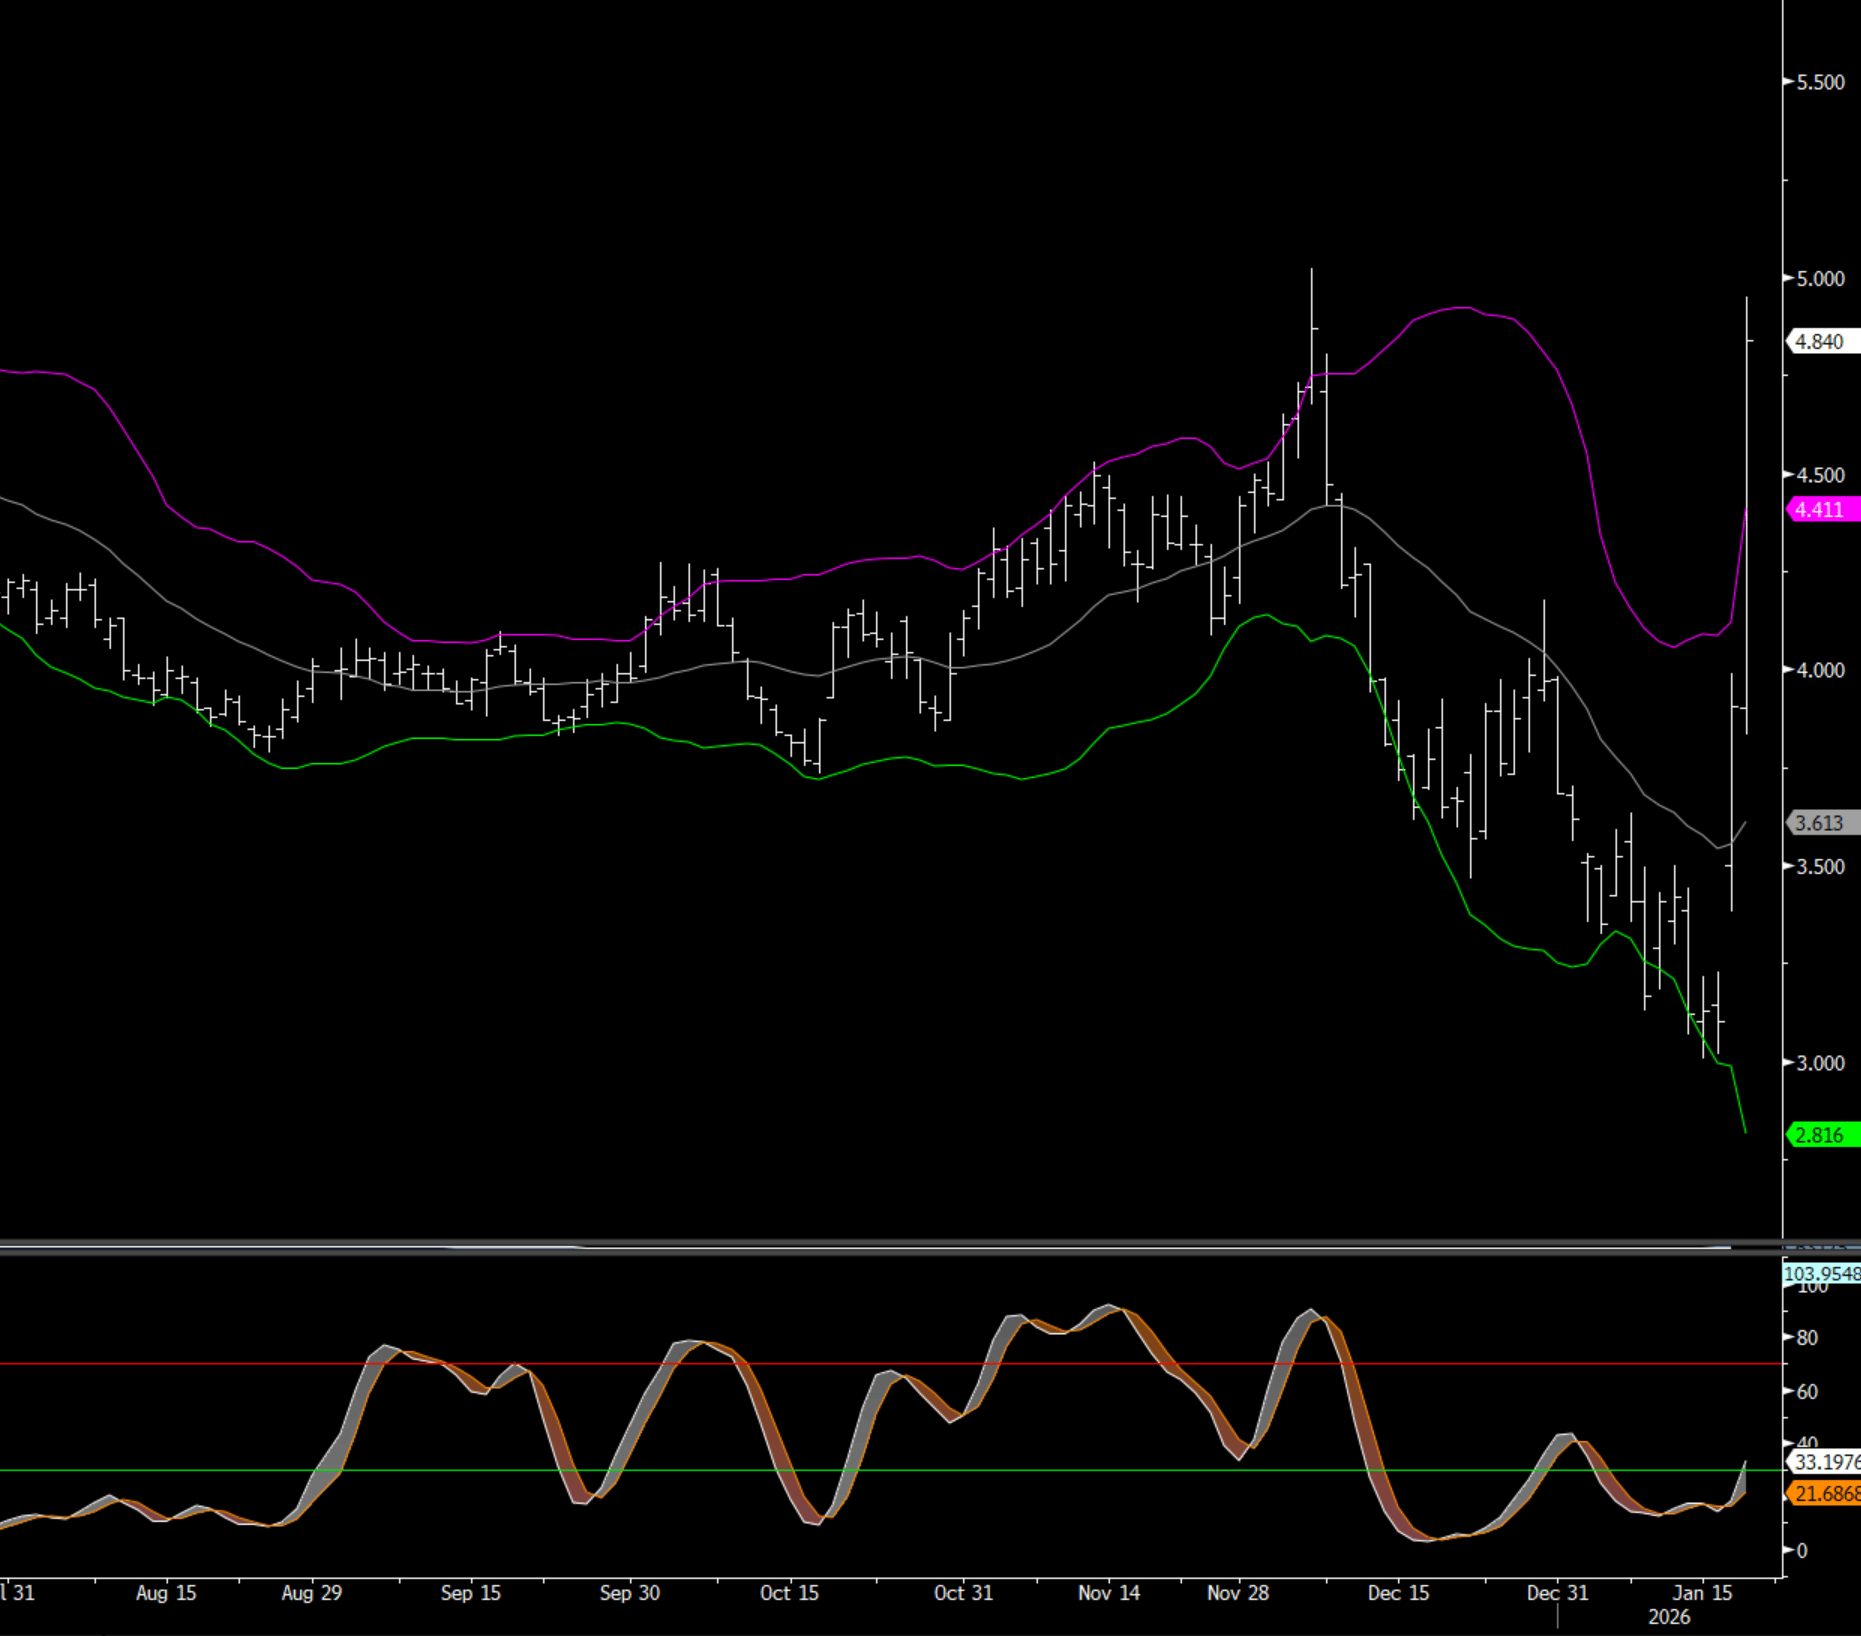
Natural Gas Market Overview
Feb Nat Gas is up .90 this morning at 4.83. Trading close to early December high of 5.02.
NG futures have surged higher today on the back of expected very strong demand and the possibility for freeze offs that will shut in some production. Average L48 temperatures are forecast to drop well below normal from Jan. 23 and extending into early February. Celsius Energy is projecting a draw of 370 BCF for the week of Jan 24-Jan 30 --that would be the largest ever draw --topping the -359 BCF figure from January 2018. Some short covering has also likely helped boost the NG higher the past 2 days.
Global liquefied natural gas (LNG) output is set to jump this year, easing constraints seen since the 2022 Ukraine war and dampening prices, which could spur demand including from top importers China and India, analysts say. (Reuters)
This year marks the start of a large wave of supply that analysts expect to last until 2029, depressing prices that could drive more demand from emerging economies.
Estimates from S&P Global Energy, Kpler and Rystad Energy forecast at least 35 million metric tons of new capacity coming online this year, primarily from the U.S. and Qatar.
This could lift global LNG supplies by up to 10% year-on-year, with 2026 supply forecasts from Kpler, Rystad, ICIS and Rabobank in a range of 460 million and 484 million metric tons.
With Asia LNG and European gas prices easing, price spreads to U.S. benchmark Henry Hub will narrow, squeezing U.S. LNG export margins at a time when feedgas costs are rising, said analysts at Vortexa, Rabobank and S&P Global Energy.
China's 2025 imports slumped amid weak industrial demand, U.S. tariffs, and strong domestic and piped gas supply. Demand this year is set to rise but may still fall short of 2024 levels, said Rystad Energy analyst Ole Dramdal, forecasting imports at 76.5 million tons this year, up 12% from 2025, as Beijing prioritizes domestic production.
Enjoyed this article?
Subscribe to never miss an issue. Liquidity’s Daily Energy Market Updates provide a comprehensive analysis of both the fundamentals and technical factors driving energy markets.
Click below to view our other newsletters on our website:
Disclaimer
This article and its contents are provided for informational purposes only and are not intended as an offer or solicitation for the purchase or sale of any commodity, futures contract, option contract, or other transaction. Although any statements of fact have been obtained from and are based on sources that the Firm believes to be reliable, we do not guarantee their accuracy, and any such information may be incomplete or condensed.
Commodity trading involves risks, and you should fully understand those risks prior to trading. Liquidity Energy LLC and its affiliates assume no liability for the use of any information contained herein. Neither the information nor any opinion expressed shall be construed as an offer to buy or sell any futures or options on futures contracts. Information contained herein was obtained from sources believed to be reliable, but is not guaranteed as to its accuracy. Any opinions expressed herein are subject to change without notice, are that of the individual, and not necessarily the opinion of Liquidity Energy LLC
Reply