- Daily Energy Market Update
- Posts
- Daily Energy Market Update January 2,2026
July 25, 2026
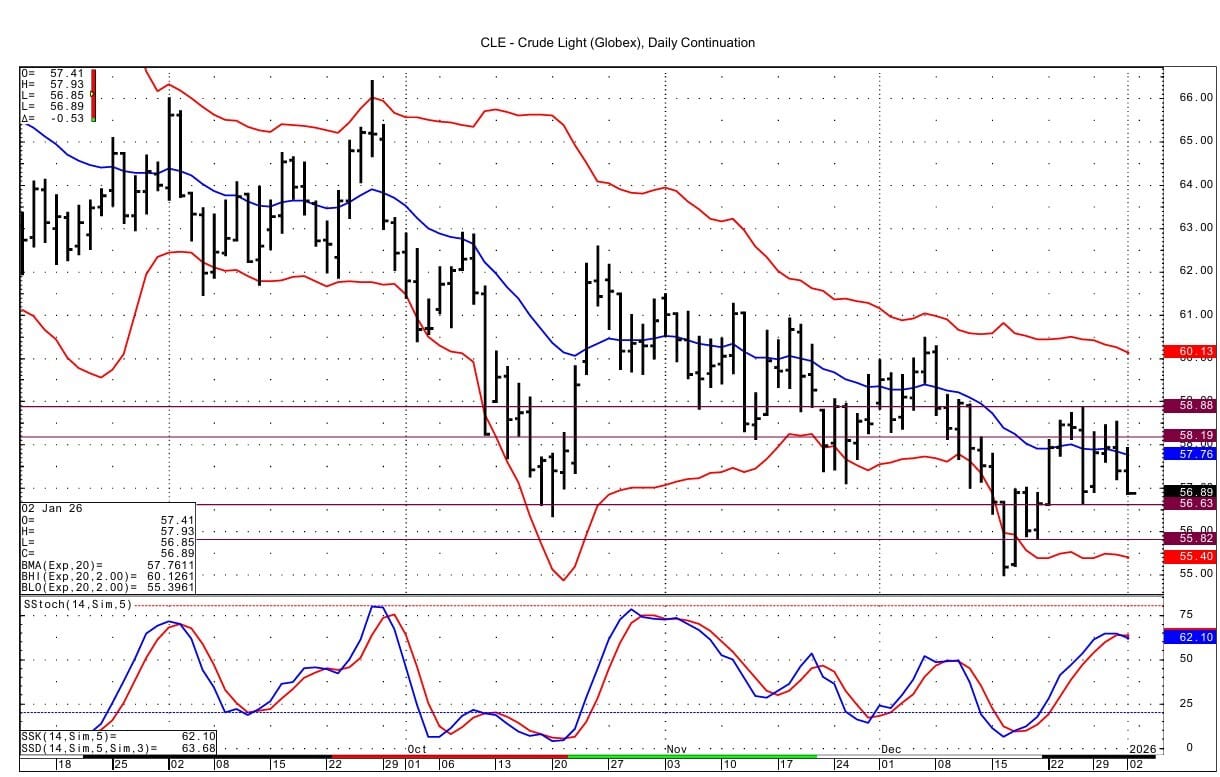
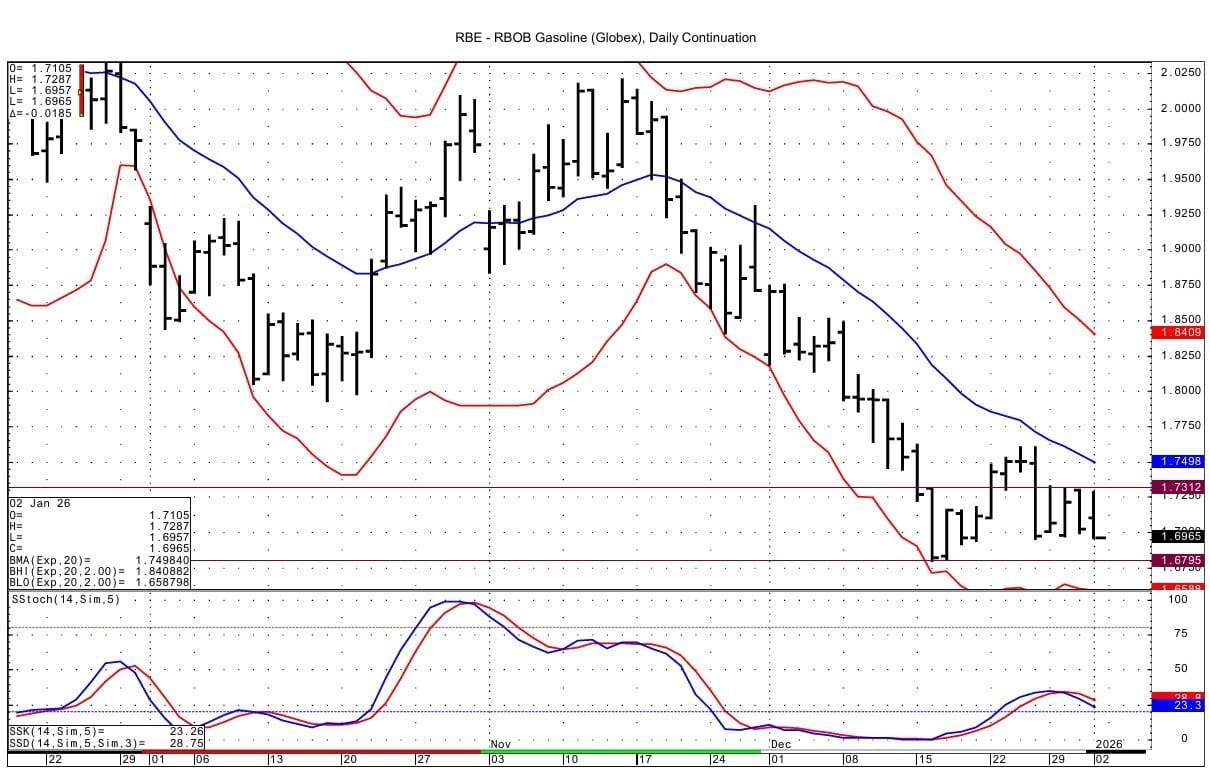
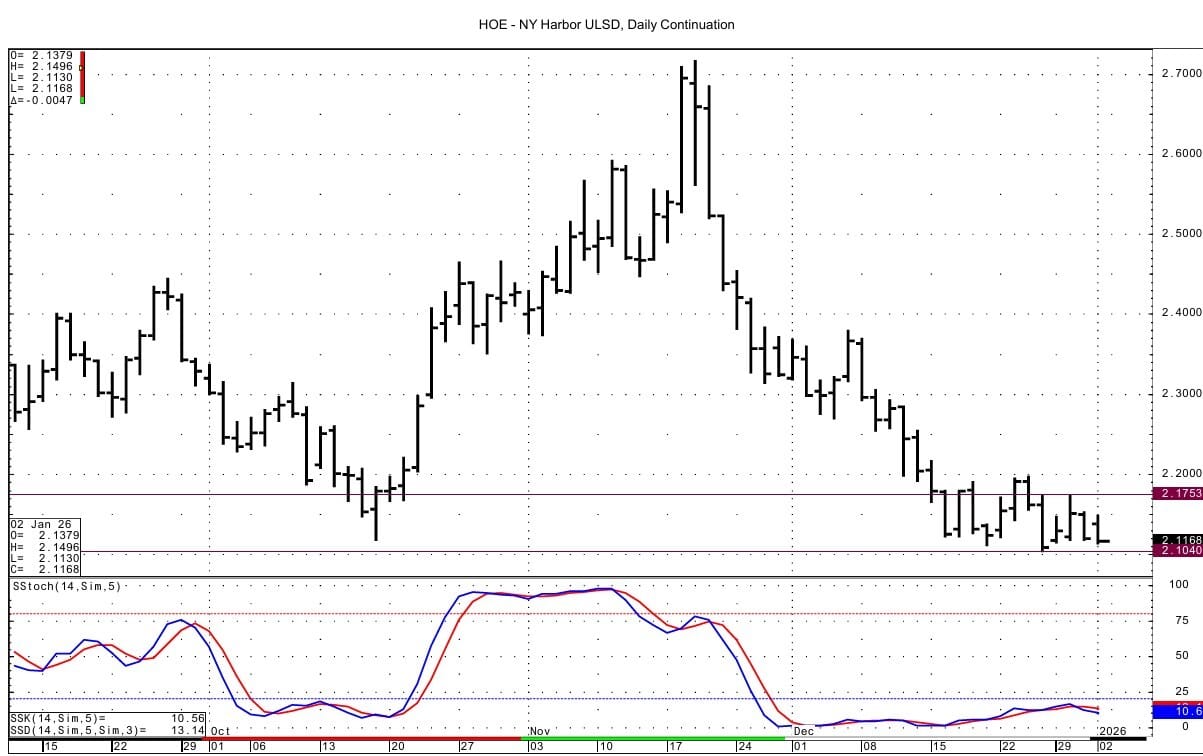
WTI is down 55 cents at $56.87 RB is down 2.03 cents at $1.6947 ULSD is down 1.15 cents at $2.1100
Liquidity’s Daily Market Overview
Energies are lower. The news wires talk of crude being soft as oversupply concerns are greater than the support seen from geopolitical tension --most notably the ongoing conflict in Ukraine and the US blockade of Venezuela. Other words being used for the crude oil market are "drifting" and "steady". At present, protests being seen in Iran are having little impact on oil prices.
The Ukrainian military said on Thursday that it had struck the Ilsky oil refinery in Russia's Krasnodar region in the latest wave of drone attacks. (Quantum Commodities)
The Trump administration's efforts to increase pressure on Venezuelan President Nicolas Maduro continued with Wednesday's imposition of sanctions on four companies and associated oil tankers that it said were operating in Venezuela’s oil sector. (Reuters)
In the Middle East, a crisis between OPEC producers Saudi Arabia and the United Arab Emirates over Yemen has deepened after flights were halted at Aden's airport on Thursday. (Reuters) The recent dispute centered around a strike on a Yemeni port that serves as the gateway to the country's oil region. (WSJ)
Unrest has been growing in Iran since last week, as protests erupted over the government’s handling of a sharp fall in the nation’s currency and soaring prices. President Donald Trump said Friday that if Iran “violently” intervenes with peaceful protests, the U.S. will “come to their rescue.” (CNBC) Protests in Iran entered a fifth consecutive day on Thursday, with demonstrations and clashes reported across Tehran and multiple provincial cities as authorities, state-linked media and rights groups cited additional deaths overnight. (Fox News)
Attention is also focused on an OPEC+ meeting scheduled for Jan. 4, where the producer group is widely expected to stick with its decision to halt further output increases. (Investing.com)
Wednesday's DOE oil data showed a draw in crude supplies (-1.934 MMBBL) greater than forecast, but the product builds were more than forecast. RB inventories rose by 5.845 MMBBL and Distillates by 4.977 MMBBL. The crude draw was largely due to a drop in crude oil imports. They were the lowest at seen since February 2021. Crude imports fell by 1.133 MMBPD to 4.953 MMBPD. We believe that this drop in crude oil imports is largely due to the desire to keep inventories at sea to avoid year end taxation. Product demand fell on the week, but was better than seen in the prior 2 years. Gasoline demand fell by 379 MBPD to 8.563 MMBPD. This beat the prior 2 years' demand of 8.168 and 7.954 MMBPD. Distillate demand fell by 777 MBPD to 3.379 MMBPD, beating the prior 2 years' figures of 3.232 and 2.658 MMBPD. Market News added that the Gulf Coast region's refinery utilization percentage of 97.8% was the highest since June of 2023.
The CFTC COT report from Dec. 31 for the week ended December 23 showed money managers added some length in WTI futures/options, while reducing net length in RB & ULSD. WTI net length on ICE/CME combined rose by 8,067 contracts. Product net length held fell as mostly longs were reduced. RB net length fell by 9,949 contracts, while ULSD net length fell by 9,346 contracts.
Energy Market Technicals
Momentum is negative for the energies basis their DC charts.
WTI spot futures have support at 56.60-56.65 and then at 55.82-55.88. Resistance lies at 58.13-58.19 and then at 58.88-58.94.
RB spot futures see support at 1.6795 and resistance at 1.7301-1.7312.
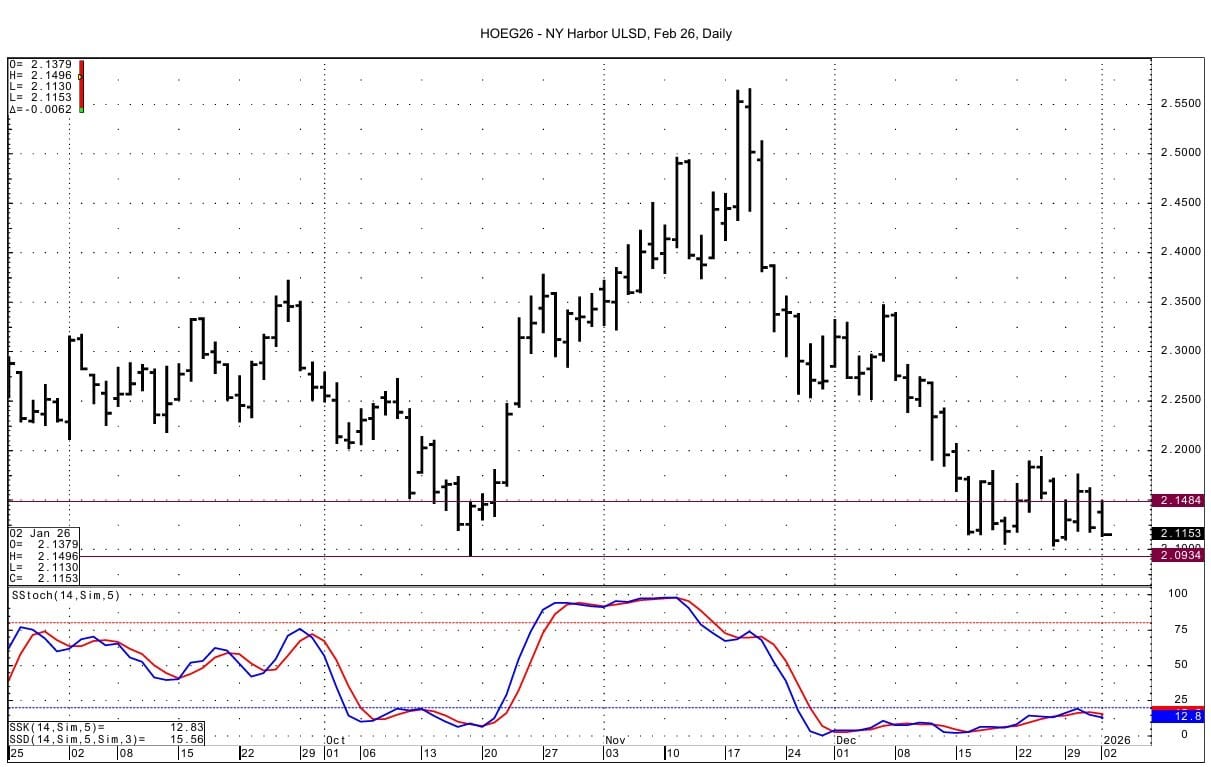
ULSD support for the spot futures comes in at 2.1040 and then at 2.0934. Resistance lies at 2.1484-2.1503, which was tested with an overnight high of 2.1496. Above that resistance is seen at 2.1745-2.1753.
.Natural Gas Market Overview
Natural Gas--NG is down 6.8 cents at $3.618
NG spot futures are down again today as weather demand has been lowered again.
Both the near-term (14 days) & extended-term (44 days) temperature outlook have trended milder over the past 48 hours, driving accumulated GWDDs weaker, as per Celsius Energy commentary.
The EIA gas storage data seen Wednesday showed a draw of 38 BCF. The EIA data came in about 8 to 12 BCF less than forecast. The EIA data lowered total gas in storage to 3.375 TCF, which was 35 BCF/1.60 % below last year's level, but saw the deficit to the 5 year average seen one week ago flip to a surplus this week of 58 BCF / 1.75%.
CFTC data released on Dec. 31 showed money managers added a sizable amount to their net short total in options/futures on the CME in the week ended December 23. The net short total rose by 40,183 contracts to 105,906 contracts. This was mostly a result of new shorts having been added.
Notable trades on the CME seen Wednesday were in the October 2026 January 2027 CSO. The minus 65 cent call was sold and the minus $1.50 put was sold against the purchase of the minus $1.00 put for a cost of 5.0 cents. The minus $1.00 put in the Oct Jan CSO was also bought against the selling of the minus 65 cent call and minus $1.25 put for a total cost of 1/2 cent.
TTF European gas futures are higher today as cold weather blankets the region. The European gas storage deficit has widened to -423 BCF or -14.7%, which is a new 52-week high. Expect the cold air to stick around and for this deficit to reach -500 BCF over the next 2-3 weeks, according to Celsius Energy data. S&P analysis says that Europe entered winter with materially lower storage levels than recent years and needs to pull in significant waterborne LNG volumes through January and February to stay balanced. Another analyst says that the U.S. front-month arbitrage to Northeast Asia via the Cape of Good Hope closed out further this week, pointing more strongly to Europe, while the arbitrage via Panama has also closed out and is pointing once more to Europe. (oedigital.com)
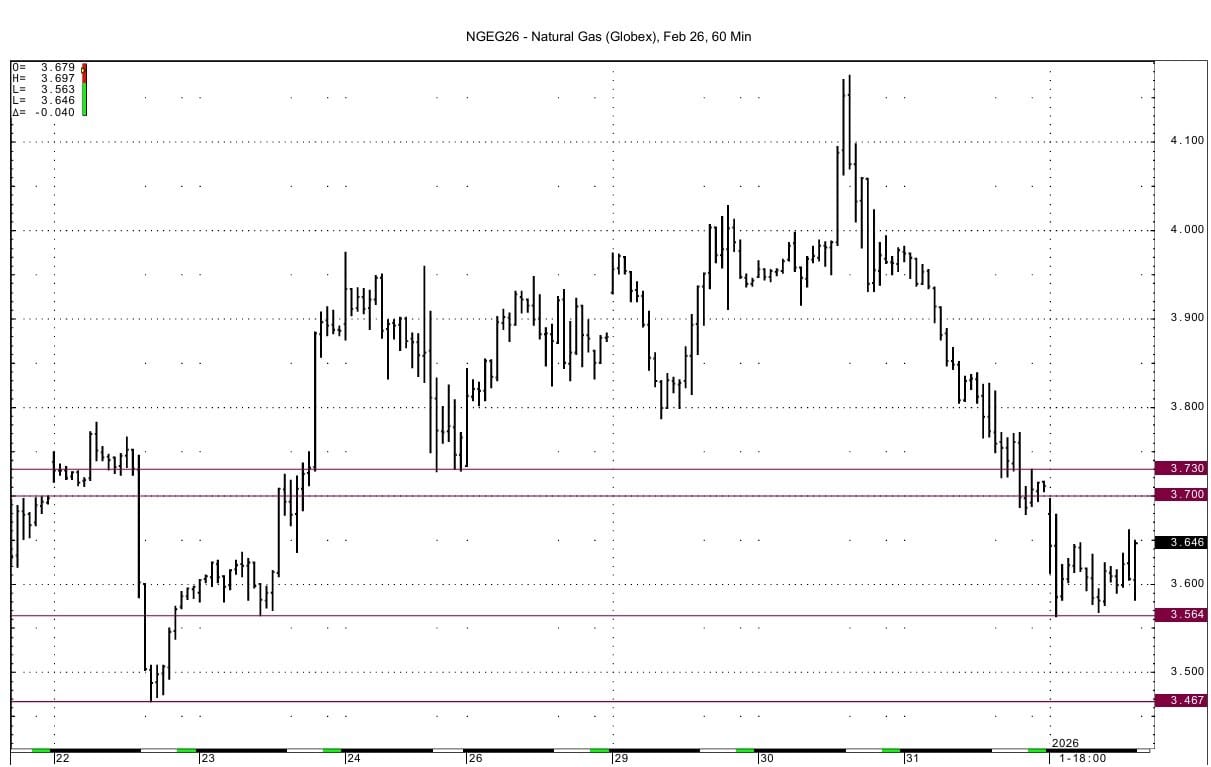
Technically NG futures have negative momentum basis the DC chart. The spot NG futures are at their lowest level since October 29 and are well into the gap created then on the DC chart. That gap goes down to 3.405. The spot NG futures tested the DC chart's 200 day moving average on the low overnight. The 200 day MA lies at 3.564 and the overnight low traded is 3.563, where we see support. Next support basis the February daily chart lies at its recent low at 3.467. Resistance comes in at the overnight high at 3.697-3.700 and then at 3.722-3.730.

Enjoyed this article?
Subscribe to never miss an issue. Liquidity’s Daily Energy Market Updates provide a comprehensive analysis of both the fundamentals and technical factors driving energy markets.
Click below to view our other newsletters on our website:
Disclaimer
This article and its contents are provided for informational purposes only and are not intended as an offer or solicitation for the purchase or sale of any commodity, futures contract, option contract, or other transaction. Although any statements of fact have been obtained from and are based on sources that the Firm believes to be reliable, we do not guarantee their accuracy, and any such information may be incomplete or condensed.
Commodity trading involves risks, and you should fully understand those risks prior to trading. Liquidity Energy LLC and its affiliates assume no liability for the use of any information contained herein. Neither the information nor any opinion expressed shall be construed as an offer to buy or sell any futures or options on futures contracts. Information contained herein was obtained from sources believed to be reliable, but is not guaranteed as to its accuracy. Any opinions expressed herein are subject to change without notice, are that of the individual, and not necessarily the opinion of Liquidity Energy LLC
Reply