- Daily Energy Market Update
- Posts
- Daily Energy Market Update January 19,2026
June 20, 2026
March WTI is down 31 cents at $59.03 March RB is down 0.38 cents at 1.8100 March ULSD is up 1.44 cents at $2.2368
Liquidity’s Daily Market Overview
Crude oil prices are lower as news wire commentary cites easing Iranian tension for the drop. Also, a brewing row between the US and Europe re tariffs is hurting crude oil prices. ULSD prices are higher, boosted by stronger weather demand, as evidenced by the very strong up move being seen in NG futures today.
Civil unrest in Iran has subsided, lowering the chance of a U.S. attack that could disrupt supply from the major Middle Eastern producer, as per Reuters commentary today. President Trump seemed to step back from his earlier threats of intervention, saying on social media Iran had called off mass hangings of protesters. (Reuters)
Tensions between the US and Europe have heated up over the weekend as a result of issues to do with US policy toward Greenland. President Trump wants to levy fresh 10% tariffs against Europe, while Europe is discussing breaking off their current trade agreement with the US, that has yet to be ratified by the EU Parliament. Europe may revive a Euro 93 billion package of tariffs on U.S. goods. The fresh tariffs by the US would kick in on 1 February and increase to 25% on 1 June, until a deal for the US to acquire Greenland is reached. The possibility of rising tariffs has seen equities fall, while pushing gold and silver to fresh record highs. (Reuters/ING/Investing.com)
Kazakh oil producer Tengizchevroil, said on Monday that it had temporarily halted production as a precautionary measure at the Tengiz and Korolev oilfields after an issue affected power distribution systems. (Reuters)
Another reason for the strength in distillates today versus crude, as per Reuters commentary, is the risk of damage to Russian infrastructure and distillate supplies at a time of forecasts of colder weather to come across North America and Europe.
Sanctions have seen crude flows to China and India shift quite a bit. China is importing the most Russian Urals crude since 2023 at prices lower than Iranian oil after top buyer India cut
imports of Russian oil sharply due to Western sanctions and before the start of a European Union ban on the import of fuel oil products made from Russian oil, according to trade sources and shipping data. India's lower demand boosted the supply of cheap Russian crude for China, providing a buffer for the loss of Venezuelan oil flows to China, as almost all of Venezuela's oil is seen heading to the U.S. China's Urals crude imports reached 405,000 barrels per day so far this month, the highest level since June 2023, data from analytics firm Kpler showed, with total seaborne imports from Russia close to 1.4 MMBPD. Vortexa data showed that China's seaborne Russian crude imports surged above 1.5 MMBPD in December, up from about 1.2 MMBPD in the first eleven months of 2025. In India, December Urals imports fell to 929,000 bpd, the lowest since December 2022, Kpler data showed, versus an average of 1.36 MMBPD in 2024 and 1.27 MMBPD in 2025. Discounts for Urals crude for delivery to China in late 2025 were as wide as $12 per barrel to ICE Brent since they were redirected to China's Shandong province from India, said a Chinese trade source, cheaper than Iranian Light which was offered at a discount of $8 per barrel at that time. (LSEG)
China's refinery throughput in 2025 rose 4.1% year on year, while crude oil output grew 1.5%, both all-time highs, government data showed. China's refinery thruput was seen at 14.75 MBPD in 2025, beating the prior record of 14.70 MMBPD. But, December's refinery runs fell to 14.7 MMBPD, from November's pace of 14.86 MMBPD and October's rate of 14.94 MMBPD. (Reuters/LSEG)
CFTC data from Friday's report for the week ended Tuesday Jan. 13 shows money managers added length in WTI futures /options by 20,680 contracts on ICE/CME combined. This was mostly a function of new longs added on the CME. RB net length rose by 9,028 contracts, But, money managers turned net short futures/options in ULSD on the CME. They sold a total of 6,519 contracts to make them net short 5,942 contracts. Speculators increased their net long in ICE Brent by 85,496 lots over the last reporting week to 208,461 lots as of last Tuesday. This is the largest position held since September. This move was predominantly driven by fresh buying, as per ING analysis.
The CME will observe shorter trading hours today. The platform will close from 2:30 to 6 PM EST today. All trades executed on the CME will be for settlement Tuesday. The February WTI futures expire Tuesday.
Energy Market Technicals
RB and crude oil momentum is negative. ULSD momentum remains positive.
March WTI futures see support at 58.32-58.38 and then at 57.83-57.88. Resistance is seen at 60.03-60.10 and then at 60.90-60.91.

March RB sees support at 1.7806-1.7821 and then at 1.7610-1.7616. Resistance comes in at 1.8427-1.8441.

ULSD March futures see resistance at 2.2813-2.2833. Support lies at the overnight low at 2.2088-2.2093 and then at 2.1823-2.1831.

Natural Gas Market Overview
Natural Gas--NG is up 47.2 cents at $3.575
NG spot futures are currently up strongly. Forecasts seen over the weekend boosted weather demand. Near term GWDD demand is seen at the highest level in the past 6 years.
Celsius Energy is forecasting a very strong withdrawal of 302 BCF for the week ended Jan. 30. That would be only the 5th withdrawal ever over 300 BCF. Celsius Energy sees the next 2 weeks GWDD total demand at 600. This beats the amount for the period seen in the prior 5 years. Those years saw GWDD totals ranging from 452 to 579. GWD demand was seen higher by 43 HDD in the American model and by 42 HDD as per the European weather model in a Sunday late afternoon forecast, according to NatGasWeather data.
US domestic natural gas production is estimated 0.132 BCF/d higher today at 112.73 BCF/d, although still below the 30-day average of 113.40 BCF/d, according to BNEF data.
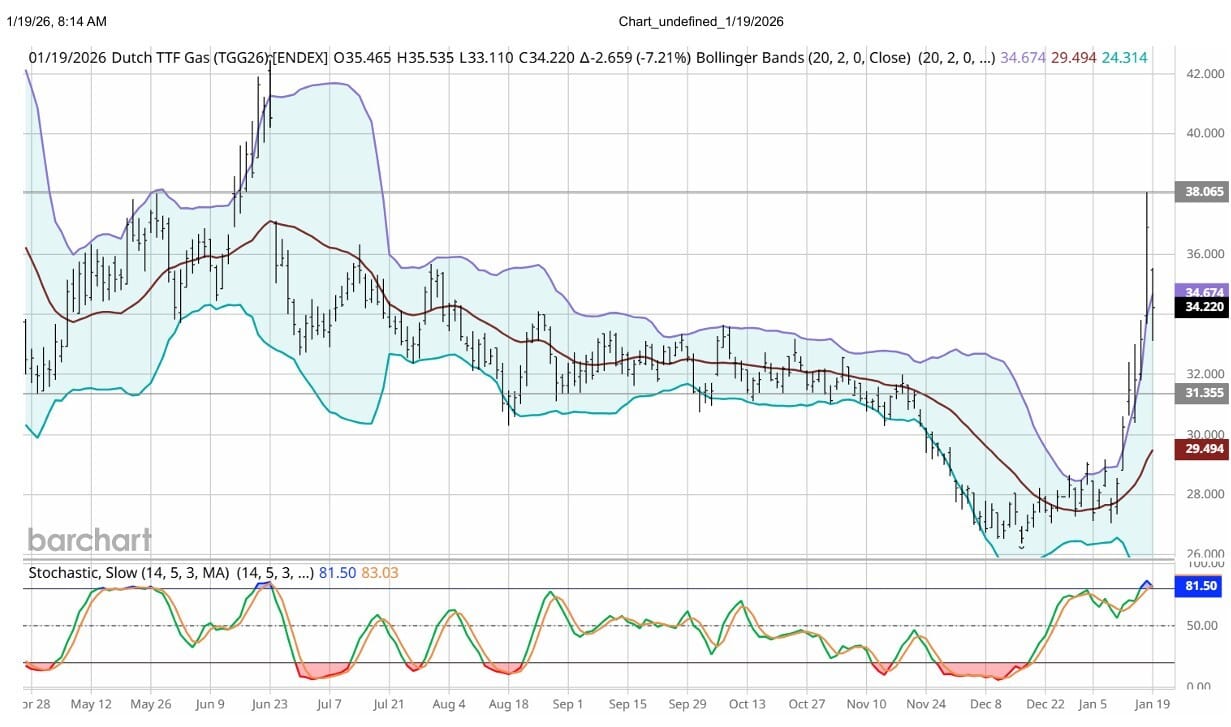
TTF prices in Europe are down about 7 % today trading near Euro 34.25 on what is said to be some profit taking after last week's nearly 30% rally. Additionally, the European price for LNG has risen over the Asian on, thus likely attracting more LNG imports, as per news wire commentary. (ING/WSJ) Technically the momentum has turned basis the DC chart for the spot TTF futures and the contract has receded to fall back under the DC chart's upper bollinger band. Upside resistance is likely at Friday's high near Euro 38. Support is seen below at the Euro 31.36 area.
CFTC data issued Friday showed money managers added some to their net short futures/options in NG on the CME. The net short position rose by 3,875 contracts to a total of 104,049 contracts. The data is for the week ended Tuesday Jan. 13. The sharp fall in NG futures during the past week makes us believe that more shorts may have been added in the latter half of the week.
Technically, there is now a gap down to 3.230 from the overnight low of 3.380. Resistance at 3.585-3.592 has been tested this morning. Resistance is then seen at 3.634. Support is likely at 3.355-3.357. Momentum is positive for the NG futures basis the DC chart.

Enjoyed this article?
Subscribe to never miss an issue. Liquidity’s Daily Energy Market Updates provide a comprehensive analysis of both the fundamentals and technical factors driving energy markets.
Click below to view our other newsletters on our website:
Disclaimer
This article and its contents are provided for informational purposes only and are not intended as an offer or solicitation for the purchase or sale of any commodity, futures contract, option contract, or other transaction. Although any statements of fact have been obtained from and are based on sources that the Firm believes to be reliable, we do not guarantee their accuracy, and any such information may be incomplete or condensed.
Commodity trading involves risks, and you should fully understand those risks prior to trading. Liquidity Energy LLC and its affiliates assume no liability for the use of any information contained herein. Neither the information nor any opinion expressed shall be construed as an offer to buy or sell any futures or options on futures contracts. Information contained herein was obtained from sources believed to be reliable, but is not guaranteed as to its accuracy. Any opinions expressed herein are subject to change without notice, are that of the individual, and not necessarily the opinion of Liquidity Energy LLC
Reply