- Daily Energy Market Update
- Posts
- Daily Energy Market Update January 16,2026
In partnership with
July 24, 2026
March WTI is up 81 cents at $59.89 March RB is up 1.04 cents at $1.8207 March ULSD is up 3.58 cents at $2.2315
Liquidity’s Daily Market Overview
Energies are higher as supply concerns remain despite President Trump's tweets of the past 48 hours, which de-escalated immediate worries about US intervention in Iran. But, analysts talk of worries over a closure of the Straits of Hormuz, which would severely restrict seaborne oil flows. Notable ( and supportive) also is the headline today from Harold Hamm, a major US oil producer, saying he is halting drilling in the North Dakota Bakken region.
Harold Hamm to Halt Drilling in Bakken Shale on Lower Prices. Harold Hamm, a billionaire who helped kick start the US shale oil revolution, said he’s about to shut down drilling in North Dakota’s Bakken for the first time in decades because of low crude prices, Bloomberg reported.
"While risks have eased somewhat, they remain significant, keeping the market nervous in the short term," ING added. "Above all, there are worries about a possible blockade of the Strait of Hormuz by Iran in the event of an escalation, through which around a quarter of seaborne oil supplies flow," Commerzbank analysts said in a note. (quotes from Investing.com and Reuters)
ING cites a tighter Brent front end spread seen yesterday, which they attribute to a decline in Kazakh oil flows from the CPC terminal.
U.S. forces seized a sixth oil tanker on Thursday morning, the U.S. Southern Command confirmed. The move could raise tensions with Russia, which has been moving to protect dark-fleet tankers in recent weeks, as per WSJ commentary.
The CME will observe shortened trading hours for Monday's MLK national holiday. The CME platform will open as usual at 6PM Sunday 1/18 (EST). The market will close at 2:30 PM (EST) on Monday 1/19 and then re-open at 6 PM on Monday, staying open until 5 PM (EST) Tuesday 1/20. All trades executed from Sunday evening until Tuesday's close will be for trade date Tuesday 1/20 and thus be settled at that day's settlement price. The WTI February futures expire Tuesday.
Energy Market Technicals
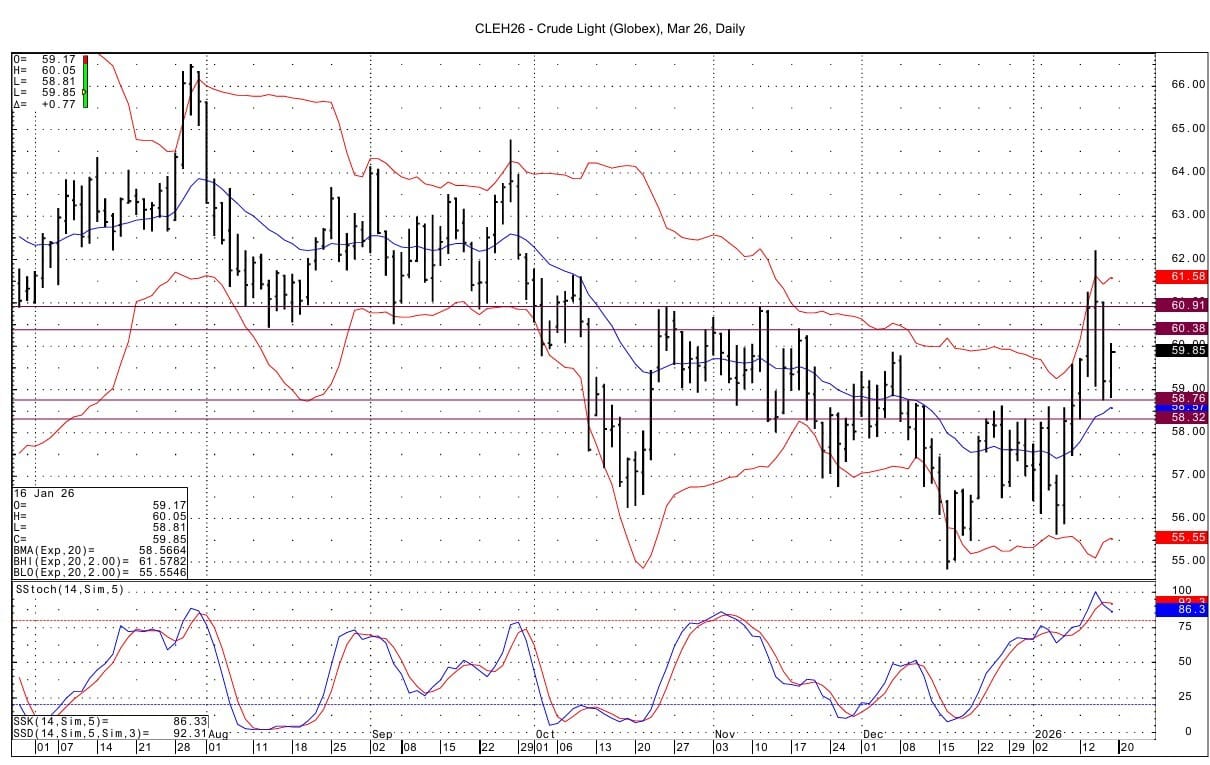
Technically the picture to us is mixed. Momentum for the RB and crude oils is negative. But, the crude oils for now looked to have carved out some near term support from the past few sessions. Momentum for the March ULSD remains positive
WTI March futures have a double bottom from yesterday/today at 58.76 / 58.81. Below that support lies at 58.32-58.39. Resistance comes in at 60.37-60.39 and then at 60.90-60.91.
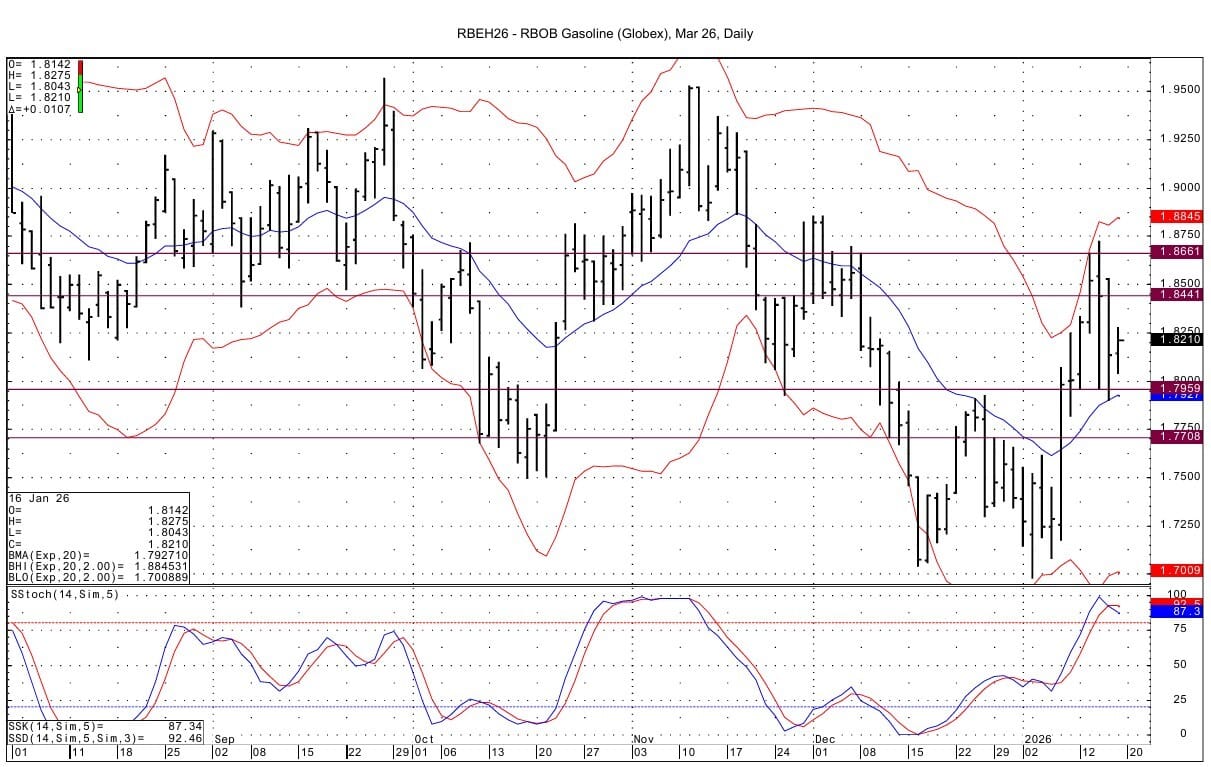
March RB support is seen at 1.7959-1.7960 and then at 1.7705-1.7715. Resistance comes in at 1.8427-1.8441 and then at 1.8661-1.8670.
ULSD support for the March futures lies at the overnight low at 2.1823-2.1831 and then at 2.1684-2.1697. Resistance comes in at 2.2510-2.2518 and then at 2.2903-2.2911.

Natural Gas Market Overview
Natural Gas--NG is down 3.7 cents at $3.091
NG futures are lower now, after rallying overnight as the end of January forecast is looking colder and will see strong storage withdrawals. Also, much of the LNG feedgas volume lost earlier in the week has been restored. We suspect some short covering has been at work the past 24 hours. Some support for NG futures may have also come from the strength seen in the European TTF marker this week.
Forecaster Atmospheric G2 said Thursday that forecasts shifted colder over parts of the central and eastern US for January 20-24. (Barchart)
US LNG feedgas demand is estimated to recover 2.31 BCF/d today to 18.91 BCF/d driven by a rebound Corpus Christi, Freeport and Plaquemines supply. (Market News)
Thursday's EIA gas storage data disappointed with a draw of 71 BCF, which was 16 to 19 BCF below forecasts from WSJ and Reuters surveys. Celsius Energy says : "the majority of the bearishness of the report was due to temperature-driven demand issues rather than underlying fundamental weakness." Celsius Energy analysis is pointing to 2 strong withdrawals of over 200 BCF at the end of the month, which will help reduce the surplus to the 5 year average. This week's EIA gas data saw total storage fall to 3.185 TCF. This left inventories 106 BCF (3.44%) over the 5 year average and 33 BCF (1.05%) over last year's level.
Today, the TTF European spot futures have risen to the best value seen since June 23, 2025. WSJ commentary today reads as follows:" prices surged on expectations of another late-month cold snap boosting heating demand, while inventories remained well below historical averages." WSJ adds that prices are on track for a weekly gain of more than 20%. WSJ says that inventories are less than 52% full, compared with a five-year average of 67%. WSJ cites an analyst who mentions that at the end of last year, index fund positions were at "the most bearish levels since early 2020.” Investment funds have already reduced their net short in TTF to 55.14 terawatt hours from 92.76 terawatt hours ( thus down just over 40%) in mid-December, according to ING commodity strategists. Today's TTF spot futures high is Euro 36.685. Technically the spot futures continue to test the upper bollinger band in the DC chart, as they have for the past 5 sessions. Momentum is not overbought. There is a gap from last June that goes from 37.100 Euro to 40.200 Euro. Support lies at the Euro 34.45 area. The low today is Euro 33.685.

Notable in the LN/NG options trading from Thursday on the CME is the drop of 11,950 contracts in open interest in the February March 1 month CSO $1.00 call. The call traded 2.5 and 2.7 cents. Additionally, the February March 1 month CSO $1.00 call was sold 3 times against buying of one 50 cent call at a cost of 2.4 cents to the lower call strike buyer. The February March 1 month CSO 25 cent put traded 2.7 and 3.0 cents in what looks like a closing trade, based on the open interest decrease seen in CME data. The February $3.25 call open interest rose over 4,000 contracts with the call having been bought versus the selling of the February $2.75 put at a cost of 9.7 cents with .55 delta futures sold at $3.14. The August $4.50 call saw open interest rise as it was bought twice versus selling of one $4.00 call at a cost of 0.3 cents with .05 delta August futures sold at $3.32. The July October 3 month CSO -30/-20/-10 cent put butterfly traded 2.5 cents as a position was opened with that trade, as per CME data.
Thursday's settlements in the front end of the NG futures curve show February settling higher by 0.8 cents, but March was lower by 5.0 cents and April was lower by 3.9 cents. We see this as being a function of 2 things in particular. One is likely short covering as the spot futures traded to almost test $3.00 on the low. Also, the next day cash/futures differential narrowed to about 13.5 cents from differentials of over 30 cents earlier in the week. The futures having narrowed its premium so much we believe made it less advantageous to press the sell side for the spot contract on Thursday.
Technically, yesterday's fall in the spot futures price filled the DC chart gap that went down to $3.024. Support is seen at 3.065-3.068 and then at Thursday's low at 3.004-3.006. Resistance lies at 3.260-3.270. DC chart based momentum for the NG futures is neutral currently.

Enjoyed this article?
Subscribe to never miss an issue. Liquidity’s Daily Energy Market Updates provide a comprehensive analysis of both the fundamentals and technical factors driving energy markets.
Click below to view our other newsletters on our website:
Disclaimer
This article and its contents are provided for informational purposes only and are not intended as an offer or solicitation for the purchase or sale of any commodity, futures contract, option contract, or other transaction. Although any statements of fact have been obtained from and are based on sources that the Firm believes to be reliable, we do not guarantee their accuracy, and any such information may be incomplete or condensed.
Commodity trading involves risks, and you should fully understand those risks prior to trading. Liquidity Energy LLC and its affiliates assume no liability for the use of any information contained herein. Neither the information nor any opinion expressed shall be construed as an offer to buy or sell any futures or options on futures contracts. Information contained herein was obtained from sources believed to be reliable, but is not guaranteed as to its accuracy. Any opinions expressed herein are subject to change without notice, are that of the individual, and not necessarily the opinion of Liquidity Energy LLC
The headlines that actually moves markets

Tired of missing the trades that actually move markets?
Every weekday, you’ll get a 5-minute Elite Trade Club newsletter covering the top stories, market-moving headlines, and the hottest stocks — delivered before the opening bell.
Whether you’re a casual trader or a serious investor, it’s everything you need to know before making your next move.
Join 200K+ traders who read our 5-minute premarket report to see which stocks are setting up for the day, what news is breaking, and where the smart money’s moving.
By joining, you’ll receive Elite Trade Club emails and select partner insights. See Privacy Policy.
Reply