- Daily Energy Market Update
- Posts
- Daily Energy Market Update January 14,2026
July 25, 2026
WTI is up 66 cents at $61.81 March RB is up 0.91 cents at $1.8649 March ULSD is up .03 cents at $2.2387
Liquidity’s Daily Market Overview
Crude oil prices are higher even as the API data seen last night showed sizable inventory increases across the board, which were well in excess of forecasts; this is especially notable in the products lagging in the up move today. Continued increased tension surrounding Iran is supporting crude oil prices due to fears of supply disruptions.
Tehran warned U.S. allies in the Middle East it would strike U.S. bases on their soil if Washington attacked Iran. Some personnel were advised to leave a U.S. military base in Qatar. U.S. President Donald Trump on Tuesday urged Iranians to keep protesting and said help was on the way, without specifying what that meant. News reports are saying that the death toll from the protests in Iran is much higher than the government is saying. Although, analysts are saying that the protests had not yet spread to the main Iranian oil-producing areas. (Reuters)
Venezuela has begun reversing oil production cuts made under a U.S. embargo as crude exports were also resuming, three sources said. Two supertankers departed Venezuelan waters on Monday with about 1.8 MMBBL each of crude in what may be the first shipments of a 50 MMBBL supply deal between Caracas and Washington to get exports moving again following the U.S. capture of Venezuelan President Nicolas Maduro. (Reuters) Exxon’s 522.5 MBPD Baton Rouge refinery and Chevron’s 356 MBPD Pascagoula refinery are preparing to run Venezuelan crude, Reuters sources said.
Much has been written over the past week or so about the increase in the Venezuelan supply having a negative effect on the price of Canadian crude oil, as both are heavy grades of oil. The Canadian bank CIBC estimates the differential between Western Canada Select, the heavy Alberta blend, and West Texas Intermediate, the U.S. light oil benchmark, will average US $14.25 a barrel in 2026. For 2025, the price gap is estimated to have averaged US$11.30 as Canadian producers benefited from the first full year of operations of the Trans Mountain pipeline expansion to the West Coast, enabling exports to Asia. The majority of the 4.4 MMBPD that Canada exports to the U.S. winds up in the Midwest, while about one-tenth heads to the Gulf. (Bloomberg)
OPEC --in their monthly report issued today --kept their 2026 demand and supply forecasts unchanged. OPEC sees 2026 global demand growth at 1.38 MMBPD and Non-OPEC+ supply growth at 630 MBPD. OPEC says their December oil production rose by 105 MBPD to 28.56 MMBPD. OPEC sees global oil demand growth in 2027 at 1.34 MMBPD, while Non-OPEC+ production is seen rising by 610 MBPD. Russian oil production in December declined by 73 MBPD to 9.304 MMBPD, according to OPEC. In its monthly report, OPEC also said Kazakhstan's oil output last month dropped by 237 MBPD to 1.522 MMBPD. (Reuters/WSJ)
The EIA's monthly STEO, issued Tuesday, lowered their global petroleum demand estimate by 0.4 MMBPD to 104.8 MMBPD, while at the same time raising their global crude oil production estimate by 0.3 MMBPD to 107.7 MMBPD. Yet, they raised their WTI and Brent price forecasts for 2026 by 79 cents from their December projection. The EIA writes:" inventory builds begin to gradually moderate next year, stemming price declines."
API Forecast Actual
Crude Oil -1.7/+2.3 +5.27
Gasoline +0.5/+3.2 +8.23
Distillate -0.45/+3.6 +4.34
Cushing n/av +0.945
Runs -0.7/0-0.2% n/av
Today is the last trading day for the February LO/WTI options. CME data shows no nearby options with any open interest over 10,000 contracts, thus suggesting the options expiration today will not cause any great fireworks at futures settlement today.
WTI open interest on the CME rose by 19,747 contracts in Tuesday's activity even as the soon to expire February contract saw open interest decline by 28,638 contracts. We see the open interest increase as mostly new longs with a whole host of contract months seeing increases, including the May thru August 2026 strip and the November 2026 thru March 2027 strip.
The national average retail gasoline price at the pump today is $2.840, as per AAA data. This is up from a low seen 3 days ago of $2.795. In yesterday's fuel update from the EIA, they said the retail gasoline price was $2.779, which was down 1.7 cents on the week and down 26.4 cents versus a year ago. The diesel fuel price they said fell by 1.8 cents on the week to $3.459. This is down 14.3 cents versus the price seen a year ago.
Energy Market Technicals
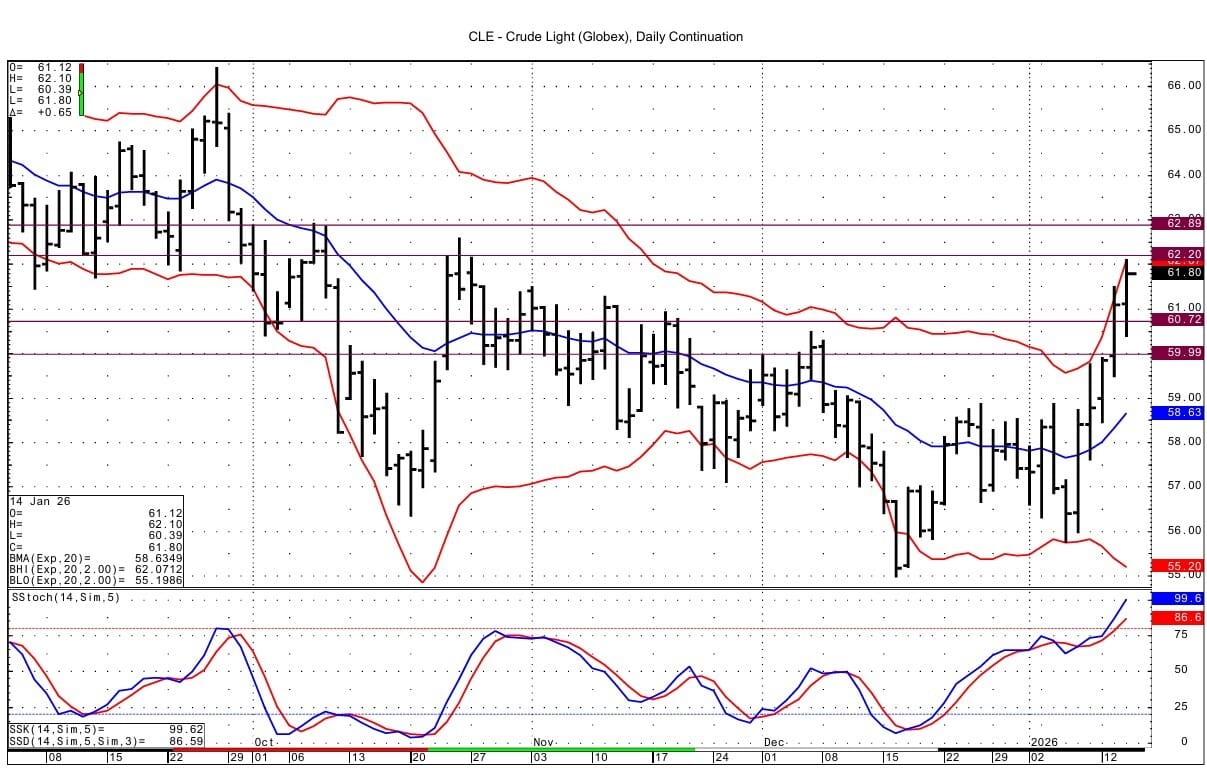
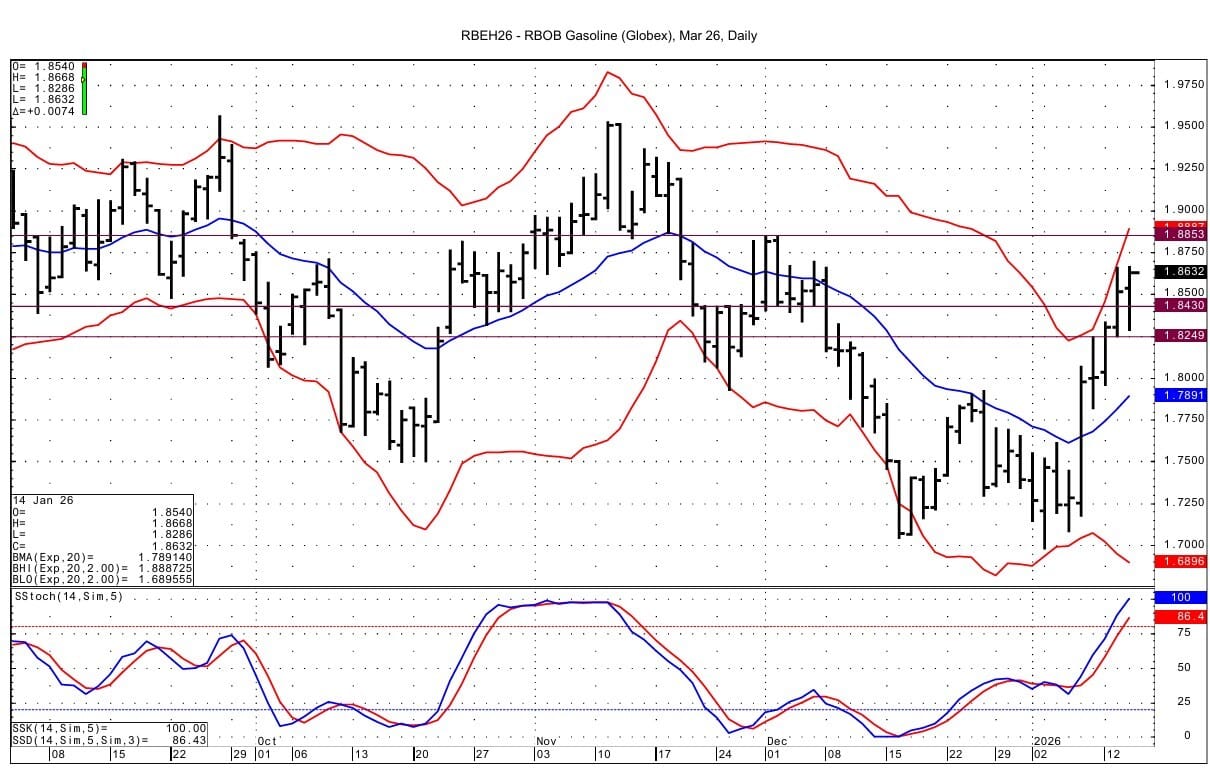
Technically the WTI spot futures are attacking the DC chart upper bollinger band again today. Momentum remains positive for the energies, although that for the RB is likely to be overbought in a day or 2 if the rally continues. We have switched to the March contract for the RB & ULSD charts as those are now the highest volume traded months.
Spot WTI futures have support at 60.67-60.72 and then at 59.94-59.99. Resistance comes in at 62.17-62.20, which is just above the current high for the day of 62.10. Above this next resistance lies at 62.87-62.92. The DC chart upper bollinger intersects at $62.06.
March RB support is seen at 1.8427-1.8435 and then at 1.8250. Resistance comes in at 1.8750-1.8763 and then at 1.8853-1.8855.
March ULSD support comes in at 2.2001-2.2016. Resistance lies at 2.2616-2.2632, especially seen in data from September of last year.

Natural Gas Market Overview
Natural Gas--NG is down 19.6 cents at $3.223
NG futures prices are lower today as the market is less convinced of colder temperatures showing up later in the forecast and the EIA's STEO did not help that narrative. Storage estimates remain high going forward, even as the nearby forecast is for some cold weather to arrive. A drop today in LNG feedgas demand is likely also weighing on prices.
US LNG feedgas demand is 0.912 BCF/d lower today at 17.2 BCF/d with a drop from Corpus Christi supply due to pipeline maintenance partially offset by a rise to Freeport after a drop yesterday amid reports of lower power. (Market News) Feedgas volume was up above 19 BCF/d a few days ago.
US domestic natural gas production was estimated at 113.05 BCF/d yesterday compared to the 30-day average of 113.53 BCF/d, according to BNEF.
Tuesday's monthly STEO saw the EIA lower their average NG price forecast for 2026 from last month's estimate. The 2026 price forecast was lowered by 55 cents to $3.46. The drop in the 2026 average price forecast is to some degree due to January temperatures being milder than normal, at a time when demand is said to be at its peak, the EIA says. The EIA adds: "Expectations of less natural gas demand have caused prices to drop sharply." The EIA slashed its Henry Hub price forecast for Q1 to an average of $3.38/mmBtu, down from $4.35 last month. But, the EIA forecasts the the 2027 average price for US natural gas rising to $4.59. The 2027 price rise is seen due to demand growth outpacing supply growth --with demand in 2027 led by increased LNG exports and electric power generation. The End of Season March 2026 inventory estimate has been raised from last month by 35 BCF to 2.031 TCF.
In LN/NG options Tuesday, the February March 1 month CSO 20 / 35 / 50 cent put butterfly traded 3.3 cents cost. Open interest data shows this having been a trade closing positions. Also in the February March one month CSO, the $1.50 call traded 1.5 cents. This was a closing trade, as well. In the April October 6 month CSO, the minus 50 / minus 40 cent call spread traded at a flat price in a 1 for 2 ratio. Additionally, the minus 40 cent call in the April October CSO traded 3.0 cents.
Technically NG spot futures look incapable of breaking over $3.50 with 2 of the past 3 sessions' highs lying at 3.496/3.499. There is resistance below that at 3.431-3.435; the overnight high is 3.443. Support below is seen at $3.193-3.200 and then at 3.131-3.136. DC chart based momentum has turned neutral--befitting the more range bound nature of recent price action.

Enjoyed this article?
Subscribe to never miss an issue. Liquidity’s Daily Energy Market Updates provide a comprehensive analysis of both the fundamentals and technical factors driving energy markets.
Click below to view our other newsletters on our website:
Disclaimer
This article and its contents are provided for informational purposes only and are not intended as an offer or solicitation for the purchase or sale of any commodity, futures contract, option contract, or other transaction. Although any statements of fact have been obtained from and are based on sources that the Firm believes to be reliable, we do not guarantee their accuracy, and any such information may be incomplete or condensed.
Commodity trading involves risks, and you should fully understand those risks prior to trading. Liquidity Energy LLC and its affiliates assume no liability for the use of any information contained herein. Neither the information nor any opinion expressed shall be construed as an offer to buy or sell any futures or options on futures contracts. Information contained herein was obtained from sources believed to be reliable, but is not guaranteed as to its accuracy. Any opinions expressed herein are subject to change without notice, are that of the individual, and not necessarily the opinion of Liquidity Energy LLC
Reply