- Daily Energy Market Update
- Posts
- Daily Energy Market Update January 12,2026
July 25, 2026
WTI is down 35 cents at $58.77 RB is up 0.54 cents at $1.7860 ULSD is down 0.07 cents at $2.1343
Liquidity’s Daily Market Overview
Crude oil prices are lower after opening the overnight session higher. Prices have eased back as Venezuelan crude oil supply concerns have eased. Concerns over supply disruptions out of Iran have eased as well, as per news wire accounts.
Commodities trader Vitol is expected to load the first cargo of naphtha from the U.S. to Venezuela this weekend under a new supply agreement announced just days ago. Vitol and its trading peer Trafigura struck agreements with the U.S. government to help market the stranded Venezuelan oil, the companies confirmed on Friday. (Reuters) US Treasury Secretary Scott Bessent has said that further sanctions against Venezuela may be lifted as early as this week to facilitate oil sales. (ING)
Iran's foreign Minister said the situation in Iran was "under total control", after violence linked to protests spiked over the weekend. On Sunday, Iran's parliamentary speaker threatened to attack American military bases in the Middle East if the U.S. acted first. (WSJ/Reuters) Iran is the fourth-largest OPEC member, producing around 3.2 MMBPD of crude oil. (ING) Iranian crude exports were seen at around 1.7 MMBPD in early 2026, with some reporting peaks over 2 MMBPD, including crude and refined products, as noted by the Foundation for Defense of Democracies (FDD) and Energy Intelligence.
Meanwhile, Ukraine continues to target Russian energy infrastructure. Over the weekend, forces targeting three platforms owned by Lukoil in the Caspian Sea. (ING)
The Baker Hughes oil rig count seen Friday showed a decrease of 3 units. Notable was the decline of 3 units in the Permian.
OPEC pumped 28.40 MMBPD in December, down 100 MBPD from November's revised total, a Reuters survey showed. The 5 members of OPEC that are a part of the OPEC+ 8 member agreement covering production were to have raised output in December by 85 MBPD; they raised it by only 20 MBPD. Reuters says that :" Many members are running close to capacity limits and some are tasked with extra cuts to compensate for earlier overproduction, limiting the impact of further increases."
Oil prices are likely to drift lower this year as a wave of supply creates a market surplus, although geopolitical risks tied to Russia, Venezuela and Iran will continue to drive volatility, Goldman Sachs said in a note on Sunday. The investment bank maintained its 2026 average price forecasts of $56/$52 per barrel for Brent/WTI, and expects Brent/WTI prices to bottom at $54/50 in the last quarter as OECD inventories build up. Rising global oil stocks and our forecast of a 2.3 MMBPD surplus in 2026 suggest that rebalancing the market likely requires lower oil prices in 2026 to slow down non-OPEC supply growth and support solid demand growth, barring large supply disruptions or OPEC production cuts," Goldman Sachs said. (Investing.com)
Energy Market Technicals
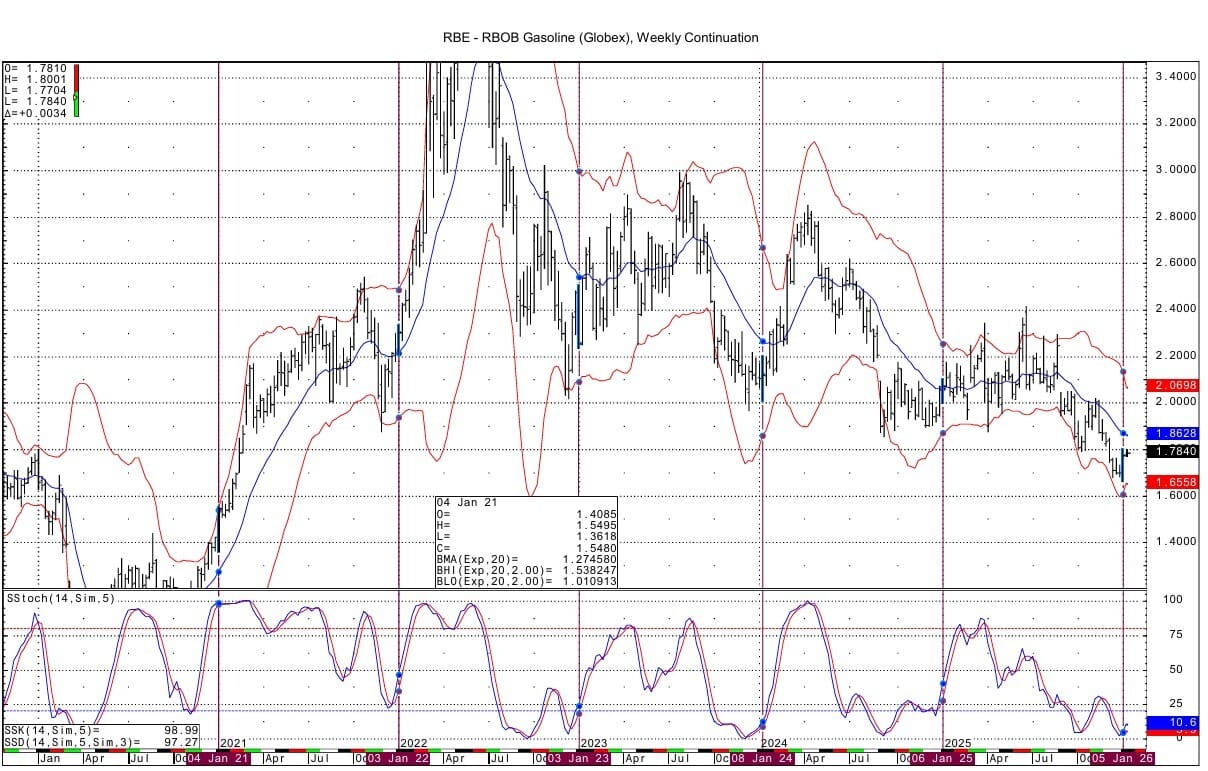
Momentum basis the DC charts remains positive. The weekly RB chart attached shows momentum turning positive. The seasonal pattern is for RB prices to rally from the first week of January level.
WTI has a double top from Friday/today at 59.80/59.77. Above that resistance comes in at 60.46-60.51. Support lies at 57.61-57.66 and then at the $57.00 level.

RB spot futures have a double top from Friday/today at 1.8001-1.8010. Above that resistance lies at 1.8405-1.8419. Support is seen at 1.7605-1.7615 and then at 1.7445-1.7452.

ULSD for February support at 2.1174-2.1180 was tested with the overnight low of 2.1175. Below that support is seen at 2.0962-2.0980. Resistance comes in at 2.1736-2.1753.

Natural Gas Market Overview
Natural Gas-- NG is up 4.1 cents at $3.210
NG futures are higher as weather forecasts turned colder over the weekend. Strong LNG feed gas demand is also supportive. Additionally, the market seems to be leaning fairly heavily on the short side.
Weather forecasts over the weekend are seen having added some demand, especially in the 6-10 day period, as per Celsius Energy. Celsius adds that there is a hint of arctic air arriving in the 14 to 18 day forecast. The demand for days 1 thru 4 is low, but the 5 thru 15 are showing moderate to high demand, as per NatGasWeather.
Friday's open interest data from the CME showed a sizable increase in NG futures. The increase of 52,958 contracts looks to us to be more so new shorts in the February, March and April contract months.
CFTC data issued Friday showed money managers raised their net short position in futures/options on the CME by 16,444 contracts to a total of 100, 174 contracts in the week ended Tuesday January 6.
TTF spot futures prices in Europe have gapped up today. The spot futures have risen to the highest level in nearly seven weeks, supported by colder weather risks, lower storage levels and rising geopolitical concerns around LNG supply. Recent cold spells have already led to faster storage withdrawals, leaving EU gas inventories about 54.9% full, well below roughly 66.9% at the same time last year. (trading economics)
The Baker Hughes gas rig count issued Friday showed a drop of 1 unit.
This week's EIA gas storage data is seen as a draw of 85 to 87.4 BCF. This compares to last year's draw of 227 BCF and the 5 year average draw of 146 BCF.
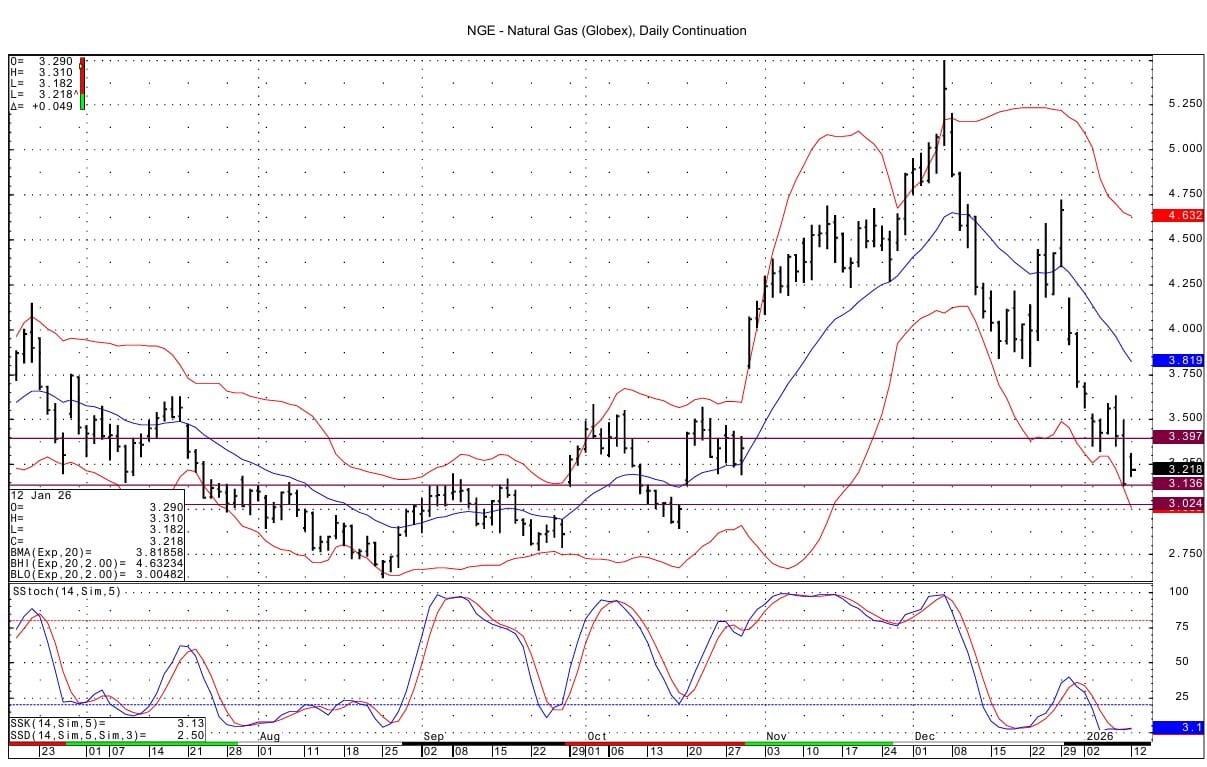
Technically, the NG spot futures price fell by 12.41% last week. NG spot futures have been down 4 of the past 5 weeks. Friday's NG futures volume was very heavy at 1,078,920 contracts. Does this suggest Friday's low of 3.131 was a near term low? Tops and bottoms are often punctuated by very high volume.
The overnight high of 3.310 in NG spot futures was seen right on the opening of the session last night. Despite the price drop in spot futures seen last week, the rally today has seen momentum trying to turn positive from an oversold condition on the DC chart. On Friday the spot futures reached into a DC chart gap left from October. Support lies at Friday's low, which was 3.131. The DC chart gap from October runs down to 3.024. Resistance comes in at 3.319-3.324 and then at 3.393-3.397.

Enjoyed this article?
Subscribe to never miss an issue. Liquidity’s Daily Energy Market Updates provide a comprehensive analysis of both the fundamentals and technical factors driving energy markets.
Click below to view our other newsletters on our website:
Disclaimer
This article and its contents are provided for informational purposes only and are not intended as an offer or solicitation for the purchase or sale of any commodity, futures contract, option contract, or other transaction. Although any statements of fact have been obtained from and are based on sources that the Firm believes to be reliable, we do not guarantee their accuracy, and any such information may be incomplete or condensed.
Commodity trading involves risks, and you should fully understand those risks prior to trading. Liquidity Energy LLC and its affiliates assume no liability for the use of any information contained herein. Neither the information nor any opinion expressed shall be construed as an offer to buy or sell any futures or options on futures contracts. Information contained herein was obtained from sources believed to be reliable, but is not guaranteed as to its accuracy. Any opinions expressed herein are subject to change without notice, are that of the individual, and not necessarily the opinion of Liquidity Energy LLC
Reply