- Daily Energy Market Update
- Posts
- Daily Energy Market Update February 4,2026
June 24, 2026
WTI is down 12 cents at $63.09 RB is up 0.20 cents at $1.8999 ULSD is up 0.31 cents at $2.4124
Liquidity’s Daily Market Overview
Products are slightly higher, while crude oil is lower now after rallying overnight as tension between the US and Iran rose Tuesday with incidents in the Mideast. API data showing a very large draw in crude supplies is also supportive as are 2 other political developments--as per news wire commentary. The US Indian trade deal and the growing disagreement between the White House and the Iraqi government regarding the appointment of the next Iraqi Prime Minister are seen supporting crude prices.
Tensions between the US and Iran have re-emerged. The U.S. military on Tuesday shot down an Iranian drone that "aggressively" approached a U.S. aircraft carrier in the Arabian Sea, the U.S. military said. In addition, Iran’s Islamic Revolutionary Guard Corps threatened to seize a US-flagged tanker in the Strait of Hormuz. (ING/Reuters)
The incidents near Iran occurred just ahead of scheduled talks between Washington and Tehran this week. But Iranian officials were also seen demanding that the talks– scheduled for Friday– be narrowed to two-way negotiations on nuclear issues, sparking doubts over whether the dialogue will even take place. (Investing.com) Bloomberg reports today that the US Iranian talks will be limited to the nuclear and sanctions issues.
On Tuesday, oil prices were also buoyed by a U.S.-India trade agreement that raised hopes of stronger global energy demand while continued Russian attacks on Ukraine added to concerns that Moscow's oil would remain under sanctions for longer. The Indian Prime Minister said that India would cease importing Russian oil. (Reuters)
As per ING commentary, there is "growing disagreement between the White House and the Iraqi government. Politicians in Iraq want to appoint Nouri Al-Malaki as the next prime minister. The US administration feels Al-Malaki is too closely aligned with Iran, which has Trump threatening diplomatic and economic consequences. Iraq is the second-largest OPEC producer, pumping a little over 4.1 MMBPD in December."
API Forecast Actual
Crude Oil -0.849/+0.5 -11.1
Gasoline +0.2/+1.4 +4.7
Distillate -1.9/-2.4 -4.8
Runs -0.6/-1.2% n/av
Cushing n/av -1.4
If EIA numbers show a similar drop in crude oil inventories, it would be the largest decline since June 2025. (ING) The large distillate draw is seen due to the winter storm and extreme temperatures that hit the US during the reporting period, which raised heating demand. The weather disrupting crude oil production in the U.S. and shipping delays in crude oil imports likely led to the crude draw.
Oil refiners on the U.S. Gulf Coast are struggling to absorb a rapid surge in Venezuelan crude shipments since last month’s flagship $2 billion supply deal between Caracas and Washington, pressuring prices and leaving some volumes unsold, according to traders and shipping data, as per Reuters reporting. Some refiners are complaining that prices, albeit declining, remain high compared to competing Canadian heavy grades. Venezuelan heavy oil cargoes for delivery at the Gulf Coast are being offered at about $9.50 per barrel below benchmark Brent, versus discounts of between $6 and $7.50 per barrel in mid-January. Total Venezuelan oil exports bounced to near 800 MBPD last month, from 498 MBPD in December. China was previously the top destination for Venezuelan oil, but none has been sent there since Maduro’s capture in early January, according to the data.
Energy Market Technicals
Technically momentum remains negative for the energies. Yet, the energies are well off the lows of the prior 2 sessions.
The WTI spot futures currently have a double top from yesterday/today at 64.21 / 64.17. Above that resistance is seen at 65.05-65.11. Support comes in at 62.18-62.25 and then at 61.21-61.25.

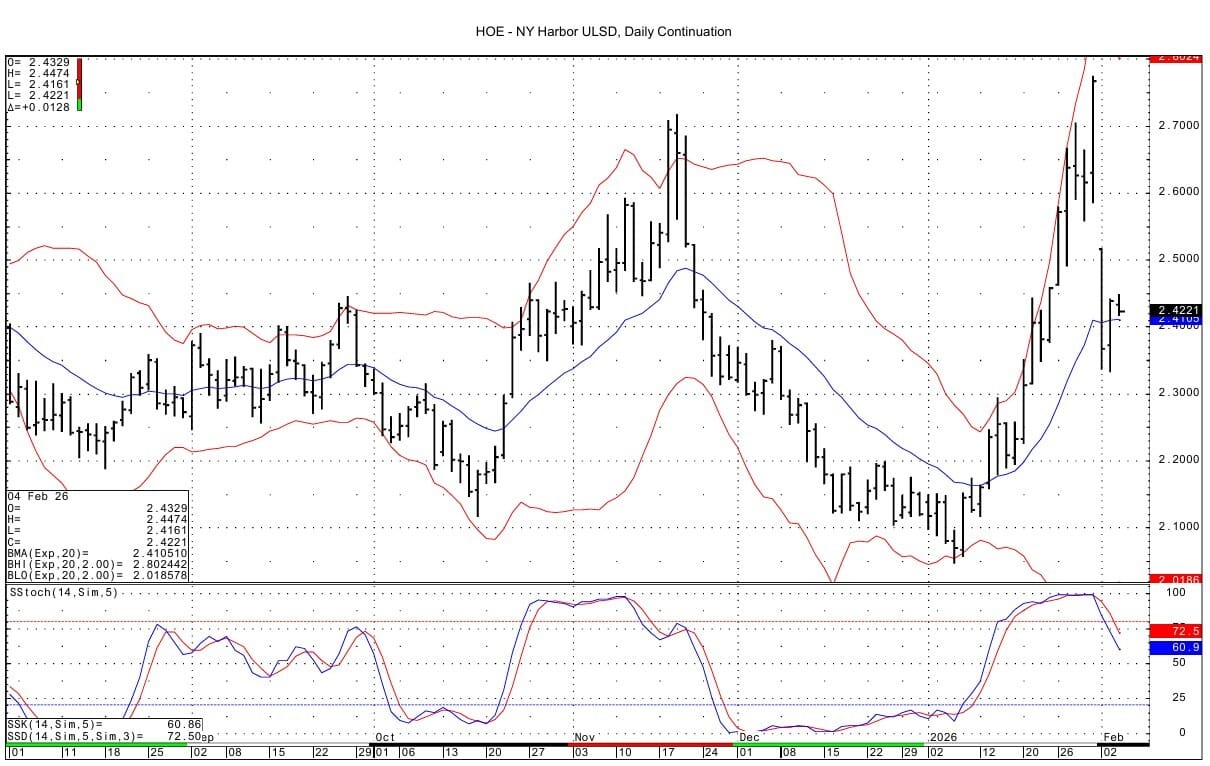
ULSD March futures see support at 2.3832-2.3840 and then at 2.3480-2.3495. Resistance comes in at 2.4470-2.4477, which was tested with the overnight high of 2.4474. Above that resistance is seen at 2.4610-2.4628.

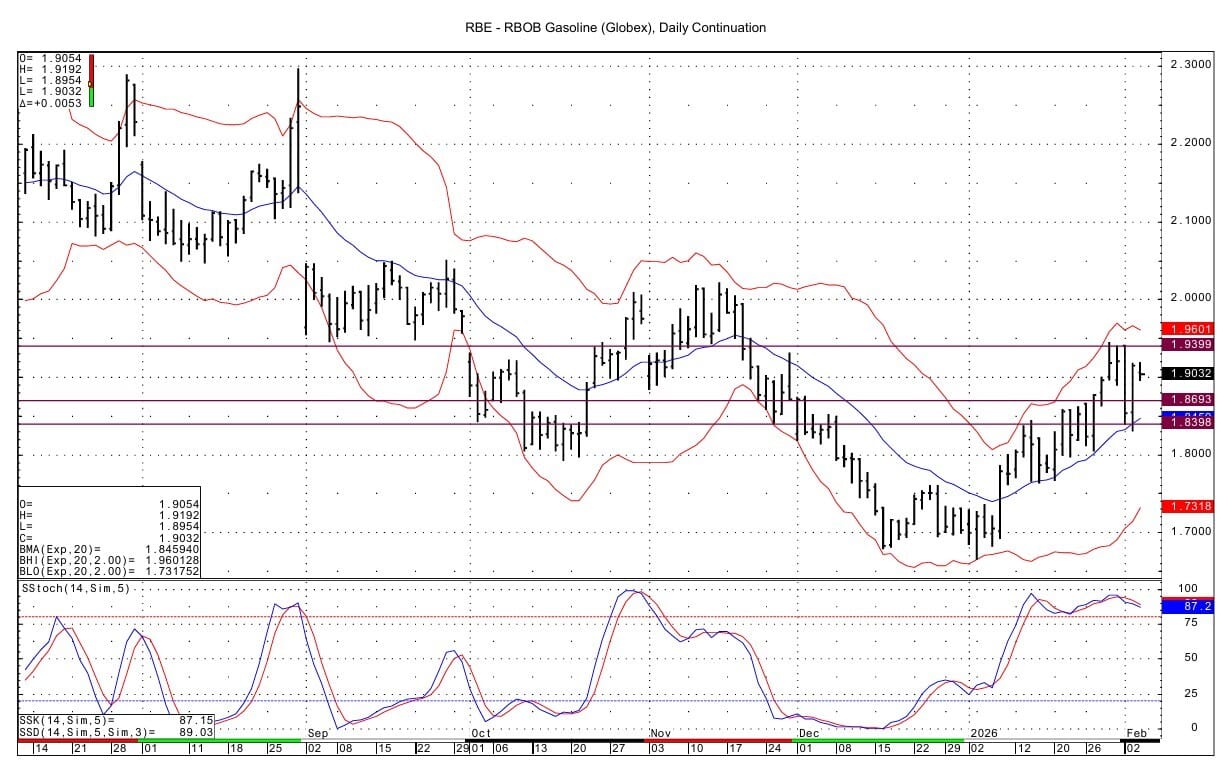
RB spot futures have support at the 1.87 area and then at the 1.84 area. Resistance lies at the 1.94 area.
Natural Gas Market Overview
Natural Gas--NG is up 5.6 cents at $3.367
NG futures are higher today following Tuesday's rebound after the extremely sharp fall seen Monday. The rally of the past 24 hours is said to be due to a slightly cooler forecast, position squaring, and some dip buying, as per comments seen.
The Commodity Weather Group said Tuesday that above-normal temperatures are expected across the Midwest and US South through February 17, but colder-than-normal temperatures are expected in the mid-Atlantic and Northeast through February 12.
Position squaring is evidenced by NG futures open interest on the CME falling a lot in Tuesday's activity. Open interest was down 54,203 contracts in total. March open interest fell by over 44,000 contracts, which we take to be mostly short covering. April open interest fell by over 8,000 lots and May by over 3,000 contracts.
The following commentary re the options market for NG was seen yesterday: "The near-term Henry Hub skew to the calls is lower so far this week as the severe cold in late Jan has eased but the market still holds a bias to cover upside prices risks. The Henry Hub second month 25 delta call-put volatility spread is back around 11% today compared to around 15% late last week and a high of 56.5% on Jan. 26 amid the peak of the cold weather disruption." (Bloomberg)
Notable were the open interest increases in some October January Calendar Spread Option (CSO) strikes. The minus 75 cent call open interest rose by 4,500 lots-with size having traded at 5.4 and 5.1 cents. The October January minus 75 cent call was also sold versus buying of the minus $1.00 call at prices of 9.5 and 9.7 cents. A new position was initiated in the minus 85 cent call in the October January CSO. 3,000 contracts of the minus 85 cent call and minus $1.75 put were sold versus buying of the minus $1.25 put at a cost of 2 cents. The October January minus $2.00 put open interest rose by 6,150 contracts. One trade seen had the minus $2.00 put option trading 4.6 cents. 11,000 contracts traded of selling of the minus 75 cent call and the -$2.00 put versus buying of the -$1.50 put at a cost of 2.3 cents. A further 3,000 contracts of the minus 75 cent/minus $2.00 put/minus $1.50 put trade was seen done at a cost of 1.3 cents. The October January futures spread settled Tuesday at -$1.115. In the March April CSO, the 50 cent/$1.00 call spread traded 3,000 contracts worth at 2.9 cents. Open interest shows decreases in those strikes. 3,000 contracts of the March April 25 cent calls traded 7.0 cents. The March April futures spread settled Tuesday at 11.8 cents.
Technically NG futures still have negative momentum basis the DC and daily charts. But, for now, the lows of the prior 2 sessions at 3.155/3.169 remain a fair way away from the current price. Has the market carved out interim lows? NG futures are having their second straight inside trading session versus Monday's price range. Resistance comes in above at 3.476-3.479 and then at 3.580-3.585. Support lies at 3.169-3.177 and then at 3.114.

Enjoyed this article?
Subscribe to never miss an issue. Liquidity’s Daily Energy Market Updates provide a comprehensive analysis of both the fundamentals and technical factors driving energy markets.
Click below to view our other newsletters on our website:
Disclaimer
This article and its contents are provided for informational purposes only and are not intended as an offer or solicitation for the purchase or sale of any commodity, futures contract, option contract, or other transaction. Although any statements of fact have been obtained from and are based on sources that the Firm believes to be reliable, we do not guarantee their accuracy, and any such information may be incomplete or condensed.
Commodity trading involves risks, and you should fully understand those risks prior to trading. Liquidity Energy LLC and its affiliates assume no liability for the use of any information contained herein. Neither the information nor any opinion expressed shall be construed as an offer to buy or sell any futures or options on futures contracts. Information contained herein was obtained from sources believed to be reliable, but is not guaranteed as to its accuracy. Any opinions expressed herein are subject to change without notice, are that of the individual, and not necessarily the opinion of Liquidity Energy LLC
Reply