- Daily Energy Market Update
- Posts
- Daily Energy Market Update February 24,2026
Daily Energy Market Update February 24,2026
Liquidity Energy, LLC
Randall Rothenberg
February 24, 2026
July 24, 2026
WTI is up 69 cents at $67.00 April RB is up 0.77 cents at $2.2546 April ULSD is up 3.20 cents at $2.5512
Liquidity’s Daily Market Overview
Energies are higher (except for Gasoil) in a quieter session with news headlines touting the fact that oil prices are hovering near a 7 month high on US-Iran tension.
The United States wants Iran to give up its nuclear program, but Iran has adamantly refused, and denied it is trying to develop an atomic weapon. Talks between the 2 are set to resume Thursday. Yesterday, a senior State Department official said that the State Department is pulling out non-essential government personnel and their families from the U.S. embassy in Beirut, amid growing concerns about the risk of a military conflict with Iran. President Trump said in a social media post on Monday that it will be a "very bad day" for Iran if it does not make a deal. (Reuters)
Tanker rates for chartering vessels to carry crude (or other dirty products such as fuel oil) have surged to the highest for more than three years as the United States and Iran edge towards war. Quantum Commodities adds that "keen demand" has also boosted tanker rates. A large amount of oil is being stored on the water, thus helping boost tanker rates. As of late 2025 and early 2026, over 1.4 billion barrels of oil were estimated to be "on the water," with a significant portion held in floating storage due to geopolitical sanctions on countries like Iran and Russia. (Vortexa) The Baltic Exchange dirty tanker index has more than doubled in the last eight months.(Reuters)
One of the consequences of the high freight rates is that West African crude prices are under pressure as the high freight rates and a firm Brent-Dubai EFS make shipments to Asia increasingly uneconomic. Bloomberg cites an analyst who say that :" differentials (for W. African crude) must fall to keep barrels competitive against shorter-haul Middle Eastern supplies."
Early estimates from Reuters for this week's API/DOE data is calling for crude oil inventories to rise by 1.3 MMBBL, while gasoline stocks are seen falling by 0.6 MMBBL and distillates to fall by 1.9 MMBBL. Refinery runs are seen rising by 0.6% to 91.0%.
Yesterday saw the March ULSD contract settle up 9.24 cents, while the April ULSD rose by 4.11 cents. The strength in the March ULSD looks to have been boosted to a fair degree by short covering, as the CME data for the open interest in ULSD futures shows March decreasing by 11,829 contracts to 29,242 contracts. Thus 28.8% of the open interest going into Monday's session was closed out.
Today both the U.S. retail gasoline and diesel prices issued by the AAA have risen to their best value seen since early December. The average gasoline price is $2.951, up from the price of a month ago of $2.862. The diesel price has risen to $3.734, versus the price one month ago of $3.561.
Energy Market Technicals
Momentum remains positive for the energies and not yet overbought.
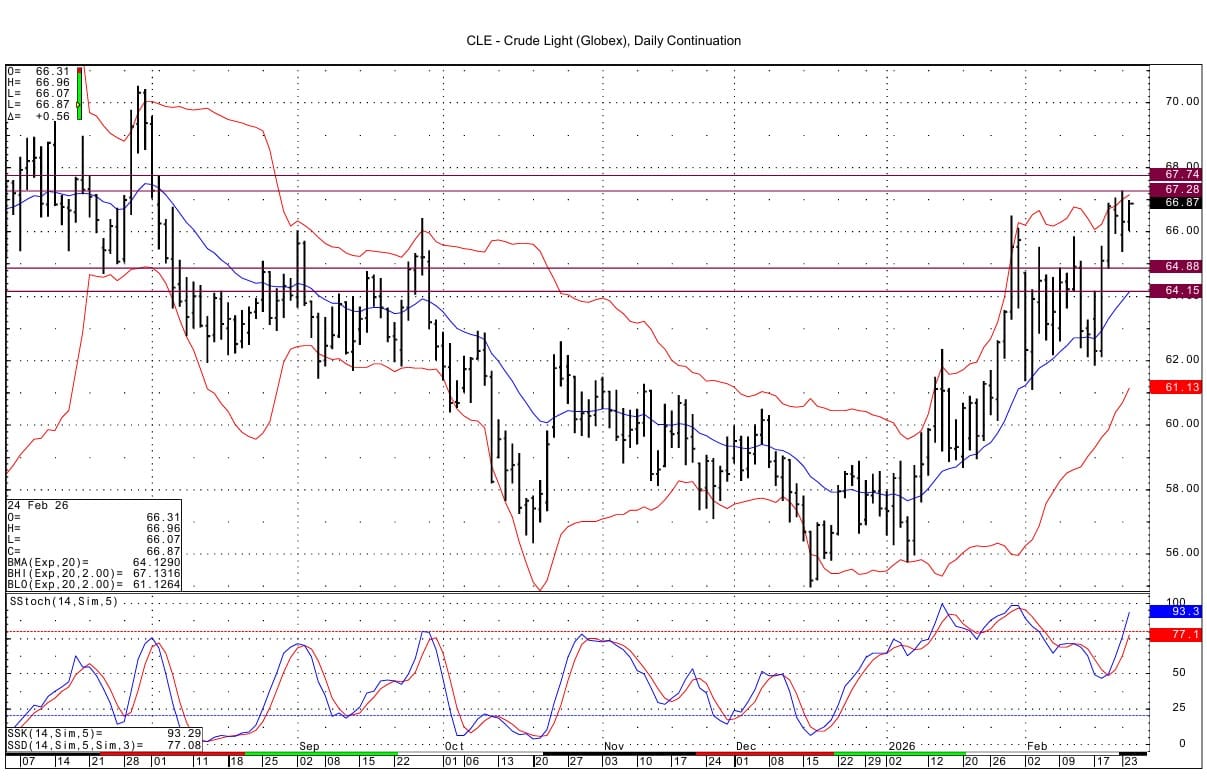
But, we see a bit of a wall of resistance having formed currently in WTI spot futures from the highs of the past 4 sessions. Those highs lie between 66.90 and 67.28. The DC chart's upper bollinger intersects at 67.12. Above the recent highs, next resistance is seen at 67.74-67.76. Support lies at 64.88.
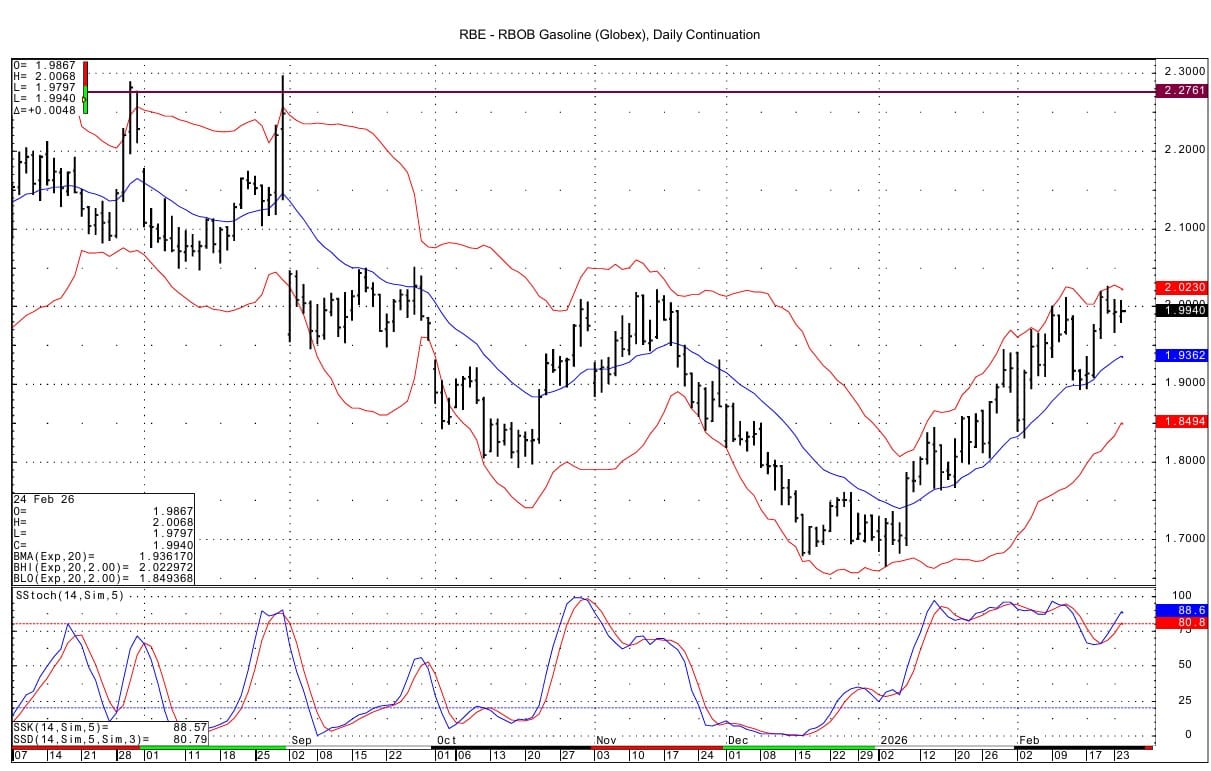
RB April futures have a double top currently from yesterday/today at 2.2644-2.2648. Above that resistance lies at 2.2761 and then at 2.2888 from DC chart data from July of 2025. Support comes in at 2.2120-2.2134. The daily chart's upper bollinger band intersects at 2.2663.

ULSD for April has resistance at 2.5570-2.5590 and then at 2.5860 from DC chart data from November 2025. Support is seen at 2.5086-2.5095 from 60 minute April chart data. The daily chart's upper bollinger band intersects at 2.5343.


Natural Gas Market Overview
Natural Gas--April NG is down 4.2 cents at $2.879
NG futures are lower again today after reversing course yesterday from a very strong opening Sunday evening to end the day lower.
The strength in the European weather model seen over the weekend was dialed back in the following 2 weather forecast runs, hence the NG market retreated. Today, heating demand keeps diminishing as the latest GFS run confirms warmer weather in the 6-10 day period. The Heating Degree Days count for the 6-10 day period in the Lower 48 US states fell by about 17 since the last run, now at 85 HDD. This is about 9 HDD below normal for this time of year. (Market News)
The EIA gas storage data due this week is seen as a draw of 34 BCF to 54 BCF. NGI says that this week's draw could be the 2nd smallest for February since 2010. Last year's draw for the period was 252 BCF and the 5 year average draw is 152 BCF. So this week's data will see the deficit to last year turn into a surplus. The low withdrawal expected this week is said to be due to the warmer temperatures across the Lower 48 last week. (NGI) Dry natural gas production in the Lower 48 averaged 110.2 BCF/d last week, up from 109.3 BCF/d the week before, as per Wood Mackenzie data.
Financial firm LSEG said average gas output in the Lower 48 states has climbed to 108.7 BCF/d so far in February, up from 106.3 BCF/d in January. That compares with a monthly record high of 109.7 BCF/d in December.
LNG feedgas volume in February is on track to set a record, having risen to 18.6 BCF/d, thus beating December's record by 0.1 BCF/d. January saw average feedgas volume of 17.8 BCF/d. The LNG feedgas volume is seen rising further in the coming week's as Exxon's Golden Pass facility is expected to ramp up further.
The Desk's weekly survey for end of March (EOS) gas in storage rose by 42 BCF to 1.790 TCF. The EIA in its monthly STEO this month projects EOS at 1.866 TCF. The Desk's weekly survey for EOS in October of this year rose by 41 BCF to 3.821 TCF. This compares to the EIA's forecast of 3.988 TCF.
In the Asian LNG market, the Asian spot price slipped to $10.60 per million British thermal units (mmBtu) in the week ended February 20, down from $10.65 previously, and also down 8.6% from the high so far this year of $11.60, reached in the week to January 30. The current spot price is for April delivery cargoes, and therefore reflects the softer demand expected in the shoulder season. The price "slipped' due to robust growth in supply, especially from the United States, and also by muted demand for spot cargoes from China, the world's biggest LNG buyer. China's imports dropped to a forecast 3.38 million tons in February, the lowest monthly total in Kpler data since April 2018 and down from 4.47 million (-15% ) in February last year. Effectively China has been shunning spot cargoes with the bulk of imports being delivered under long-term contracts. This is partly because of the mild winter across much of China reducing LNG demand and because the spot price is not competitive with the domestic price in China, which sit below $10. (Reuters)
The absence of China in spot LNG markets has allowed Europe to increase imports to meet winter demand, with Kpler forecasting record arrivals of 14.20 million tons in February, besting January's record and up 22% from a year ago. The US is supplying 57% of the LNG imports into Europe as per Kpler data. Russian LNG is still arriving in Europe. Russia is still the continent's second-biggest supplier. The bottom line conclusion from a Reuters analyst regarding the global LNG market is as follows:" The increase in U.S. exports is likely enough to maintain the current equilibrium in global LNG markets, where strong demand in Europe and steady imports in Asia are offset by sufficient supply growth."
The March LN/NG options expire today. The $3.00 strike has a total of over 71,000 contracts open as per Monday's open interest data on the CME. We wonder if this will act as a magnet for the March futures settlement today.
Technically the April NG futures have reverted to a neutral momentum condition due to the pullback seen the past 24 hours. Today, the April contract has reached into the gap on the daily chart from a little over one month ago. The gap created then went from 2.867 to 2.766. There is support at 2.793-2.804, above the closing of the gap. Resistance is likely at 3.020-3.023 and then at 3.130-3.135.

Enjoyed this article?
Subscribe to never miss an issue. Liquidity’s Daily Energy Market Updates provide a comprehensive analysis of both the fundamentals and technical factors driving energy markets.
Click below to view our other newsletters on our website:
Disclaimer
This article and its contents are provided for informational purposes only and are not intended as an offer or solicitation for the purchase or sale of any commodity, futures contract, option contract, or other transaction. Although any statements of fact have been obtained from and are based on sources that the Firm believes to be reliable, we do not guarantee their accuracy, and any such information may be incomplete or condensed.
Commodity trading involves risks, and you should fully understand those risks prior to trading. Liquidity Energy LLC and its affiliates assume no liability for the use of any information contained herein. Neither the information nor any opinion expressed shall be construed as an offer to buy or sell any futures or options on futures contracts. Information contained herein was obtained from sources believed to be reliable, but is not guaranteed as to its accuracy. Any opinions expressed herein are subject to change without notice, are that of the individual, and not necessarily the opinion of Liquidity Energy LLC
Reply