- Daily Energy Market Update
- Posts
- Daily Energy Market Update December 31,2025
Daily Energy Market Update December 31,2025
Liquidity Energy, LLC
Randall Rothenberg
December 31, 2025
July 25, 2026
WTI is up 42 cents at $58.37 February RB is down 0.45 cents at $1.7245 February ULSD is down 1.14 cents at $2.1460
Liquidity’s Daily Market Overview
Energies are mixed with crude oil higher, but the products lower in this year end session. Crude oil is higher even as the API data seen last night showed a larger than forecast build. The API product inventory data also showed larger than forecast builds. Geopolitical tension continues to underpin the crude oil market. Prices have traded in a narrow range overnight.
News wire commentaries are posting headlines touting the fact that crude oil prices are set to end the year with the steepest drop seen since 2020. Brent futures are on course to end the year down 18%. Reuters adds that this will be the third year in a row of lower prices, the longest such losing streak, they add. Yet, Bloomberg adds, Cushing OK stockpiles --the delivery point for the WTI futures contract - are at their lowest annual average storage level since 2008.
News wire accounts point to the myriad of areas globally that are currently seeing heightened tension: Venezuela with the US shipping blockade, Yemen where the UAE and Saudi Arabia are in dispute, and the ongoing attacks in the Ukraine war zone, which have led to doubts creeping in as to any near term peace agreement there. According to Bloomberg, PDVSA plans to reduce output in the Orinoco Belt by at least 25% to 500,000 b/d, which could shave some 15% off Venezuela’s total liquids production. Storage tanks are filling up in Venezuela, thus leading to the need to dial back production.
API Forecast Actual
Crude Oil +0.1 +1.7
Gasoline +0.3 +6.2
Distillate +0.8 +1.0
Runs -0.2% n/av
Cushing n/av +0.8
Overnight, upbeat news from China was seen, as their official PMI reading for December showed the first expansion in 9 months. The official manufacturing purchasing managers index rose to 50.1 in December, above the 49.2 forecast by economists polled by Reuters, and higher than 49.2 in November. (CNBC)
The Baker Hughes oil rig count seen Tuesday showed an increase of 3 units.
The upcoming January 4th meeting of OPEC+ is seen leaving policy unchanged, as per a Bloomberg report.
The EIA, on Tuesday, in their weekly retail fuel price update, showed the gasoline price at $2.787, which was down 3.0 cents on the week and was the lowest retail price seen since March
8,2021. The diesel retail price fell by 4.4 cents on the week to $3.500.
The CME will close its energy trading platform at its usual time today at 5PM. The energy market will re-open at 6 PM Thursday and remain open until 5 PM Friday Jan. 2. Today is the last trading day for the January RB & ULSD contracts.
Energy Market Technicals
Momentum for the products basis the February daily charts is trying to stay positive. WTI's momentum on the DC chart remains positive.
WTI spot futures have support at 56.99-57.01 and then at 56.60-56.65. Resistance lies at 59.17-59.21 and then at 59.64-59.67.
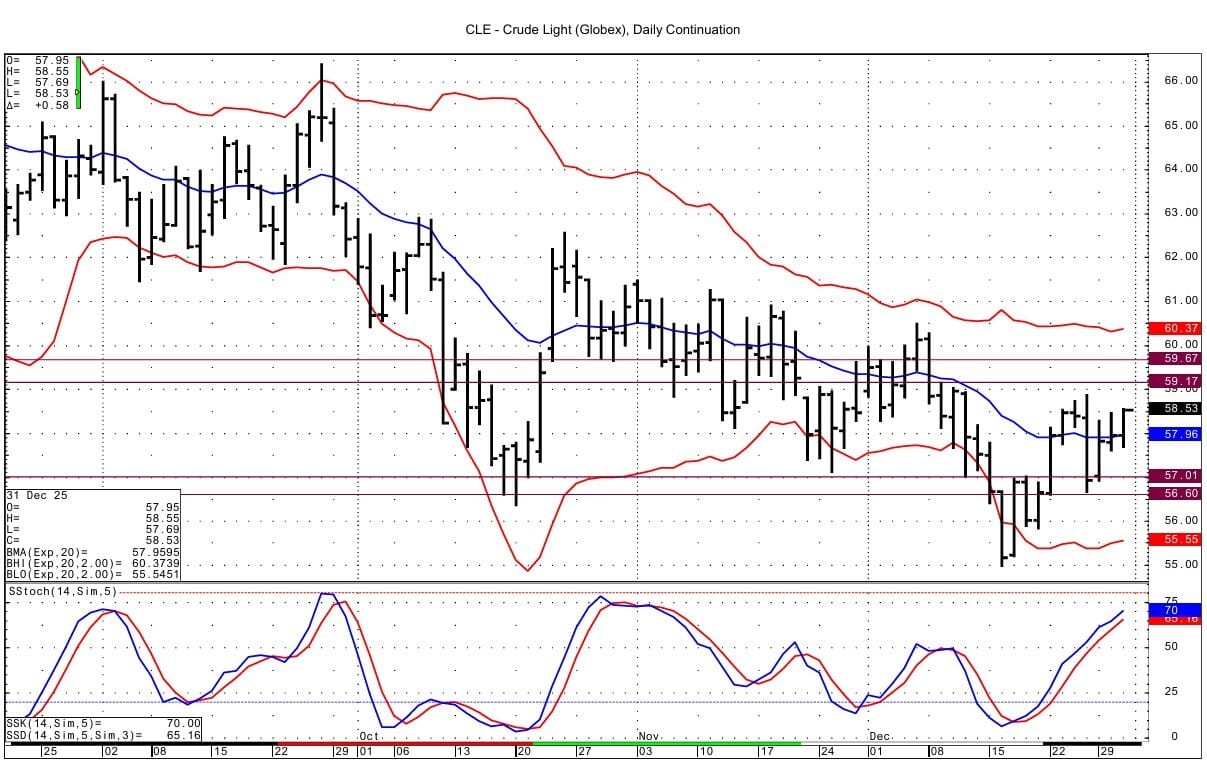
February RB support is seen at 1.7047-1.7050. Resistance lies at 1.7679-1.7692.

February ULSD support comes in at 2.1038-2.1054. Resistance lies at 2.1941.

Natural Gas Market Overview
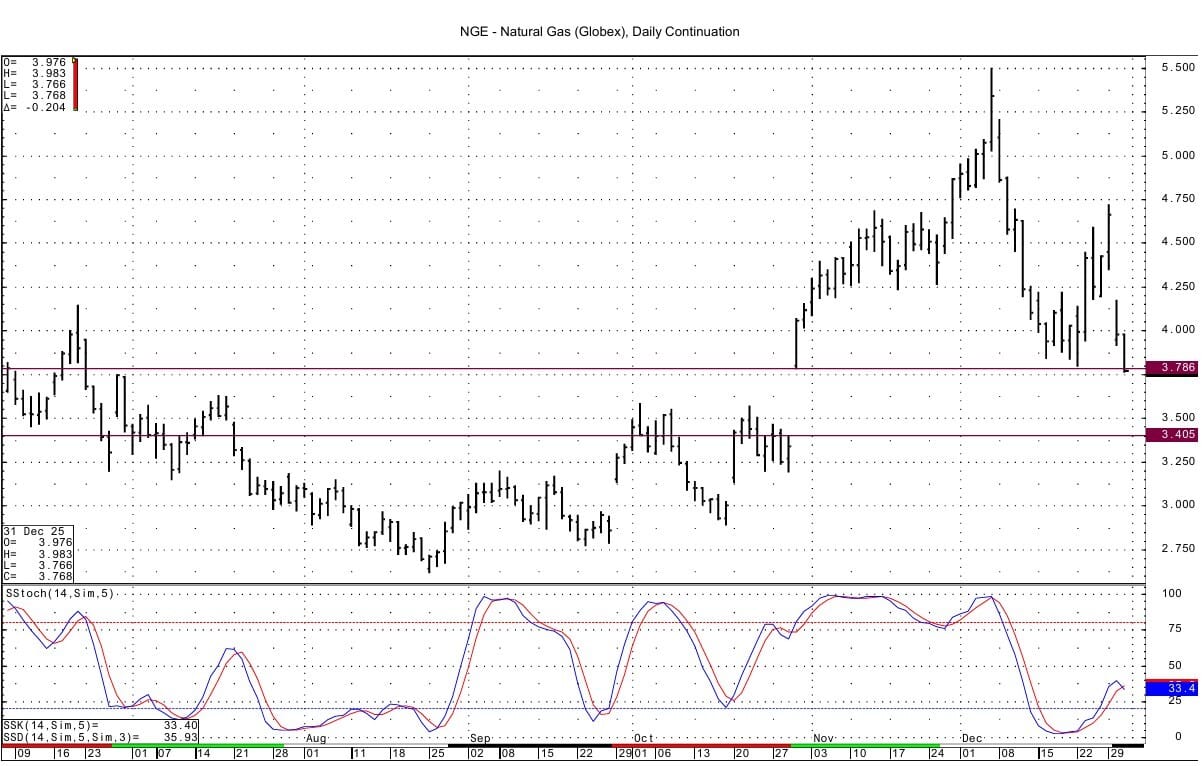
Natural Gas -- NG is down 19.6 cents at $3.776
NG futures have fallen further today as the forecasts are calling for above normal temperatures for much of the U.S. in the 6-10 day period. The well below average storage draw due out today is also likely weighing on prices.
NOAA’s 6-10 day forecast (Jan 4th-8th) calls for much of the country to have above normal temperatures.
The EIA gas storage data to be released today at Noon for the week ended Friday Dec. 26 is forecast to show a draw of 46 to 53 BCF as per news wire surveys. This compares to last year's draw of 112 BCF and the 5 year average draw of 120 BCF.
The Baker Hughes gas rig count seen Tuesday showed an decrease of 2 units.
Technically, the DC chart for NG shows momentum having turned negative as the spot futures are well off the high seen just 24 hours ago. The spot futures are attacking the DC chart gap left by the expiration of the November contract at the end of October. The gap then went from 3.786 down to 3.405. Near-term support for the February futures lies at 3.727-3.734. Next best support below that is seen at 3.617-3.618. Resistance comes in at 3.976-3.979, which is just below the overnight high of 3.983.

Enjoyed this article?
Subscribe to never miss an issue. Liquidity’s Daily Energy Market Updates provide a comprehensive analysis of both the fundamentals and technical factors driving energy markets.
Click below to view our other newsletters on our website:
Disclaimer
This article and its contents are provided for informational purposes only and are not intended as an offer or solicitation for the purchase or sale of any commodity, futures contract, option contract, or other transaction. Although any statements of fact have been obtained from and are based on sources that the Firm believes to be reliable, we do not guarantee their accuracy, and any such information may be incomplete or condensed.
Commodity trading involves risks, and you should fully understand those risks prior to trading. Liquidity Energy LLC and its affiliates assume no liability for the use of any information contained herein. Neither the information nor any opinion expressed shall be construed as an offer to buy or sell any futures or options on futures contracts. Information contained herein was obtained from sources believed to be reliable, but is not guaranteed as to its accuracy. Any opinions expressed herein are subject to change without notice, are that of the individual, and not necessarily the opinion of Liquidity Energy LLC
Reply