- Daily Energy Market Update
- Posts
- Daily Energy Market Update December 30,2025
Daily Energy Market Update December 30,2025
Liquidity Energy, LLC
Randall Rothenberg
December 30, 2025
July 25, 2026
WTI is up 30 cents at $58.38 February RB is up 0.59 cents at 1.7331 February ULSD is up 3.27 cents at $2.1654
Liquidity’s Daily Market Overview
Energies are higher today, led by distillates. Prospects for peace in Ukraine have faded in recent days, thus supporting energy prices. News wire commentary also touts rising geopolitical tension in Venezuela and the Mideast as supporting oil prices. The up move in energies today comes even as the DOE data issued late last night was not that supportive for the crude oil.
Prospects for peace in Ukraine have faded after Moscow accused Kyiv of targeting a Russian presidential residence, and as attacks have continued by each side against the other's energy infrastructure. The ongoing U.S. blockade of Venezuelan oil and also poor weather suspending Caspian CPC Blend exports were also seen supporting prices on Tuesday. (Reuters)
Oil output in Kazakhstan declined by around 6% in December, led by a fall at the vast Tengiz oilfield after a Ukrainian drone attack damaged Russia's Black Sea exporting terminal, an industry source said on Monday. (Reuters)
The geopolitical tension has been raised as Saudi Arabia launched airstrikes against Yemen recently. Saudi Arabia said on Tuesday its national security was a red line and backed a call for UAE forces to leave Yemen within 24 hours, shortly after a Saudi-led coalition carried out an airstrike on the southern Yemeni port of Mukalla. Traders also watched other Middle East developments after U.S. President Donald Trump said the United States could support another major strike on Iran were Tehran to resume rebuilding its ballistic missile or nuclear weapons programs. (Reuters)
The DOE petroleum data for the week ended Friday December 19 was released at 5 PM Monday evening. The data disappointed slightly as crude oil inventories rose by 0.4 MMBBL, versus the estimates for a draw of 2.05 to 2.6 MMBBL. The build should have even been bigger, in our view, as net crude imports rose by 609 MBPD, while crude inputs to refineries fell by 212 MBPD. US crude production fell by 18 MBPD. Thus, the crude oil build could have been as much as 5.6 MMBBL. Gasoline supplies rose by 2.9 MMBBL, which was more than the forecasts calling for a rise in inventories of 0.3 to 0.8 MMBBL. Gasoline demand fell on the week by 136 MBPD to 8.942 MMBPD, which was less than last year's demand of 9.008 MMBPD. Distillate supplies rose by 0.2 MMBBL, which was in line with forecasts. Distillate demand rose on the week by 369 MBPD to a strong figure of 4.156 MMBPD, although that was less than last year's demand of 4.253 MMBPD. One slight negative to the distillate inventory picture is the very high production figure on the week of 5.310 MMBPD, which was 108 MBPD higher than the prior week. The distillate production was up 38 MBPD versus 2024's level and up 194 MBPD from 2023. This year's strong distillate production is not surprising given the high refining margin for distillate that was seen weeks prior, off of which refiners would have decided on their production slate.
WTI futures volume traded on the CME remained at a low level in Monday's activity. Volume was just over 400,000 contracts. Yet, notable is the fact that despite the lower volume traded, open interest in WTI futures rose on the day by over 15,000 contracts, which look to be new longs primarily in the front 3 months.
Energy Market Technicals
Momentum for the crude oil and distillates is positive, while that for the February RB looks to be cresting.
WTI spot futures see support at 57.38-57.42 and then at 56.60-56.65. Resistance lies at 59.17-59.21 and then at 59.64-59.67.

February RB support lies at the lows from today and Friday at 1.7047-1.7050. Below that support is seen at 1.6839-1.6840. Resistance comes in at 1.7679-17692.

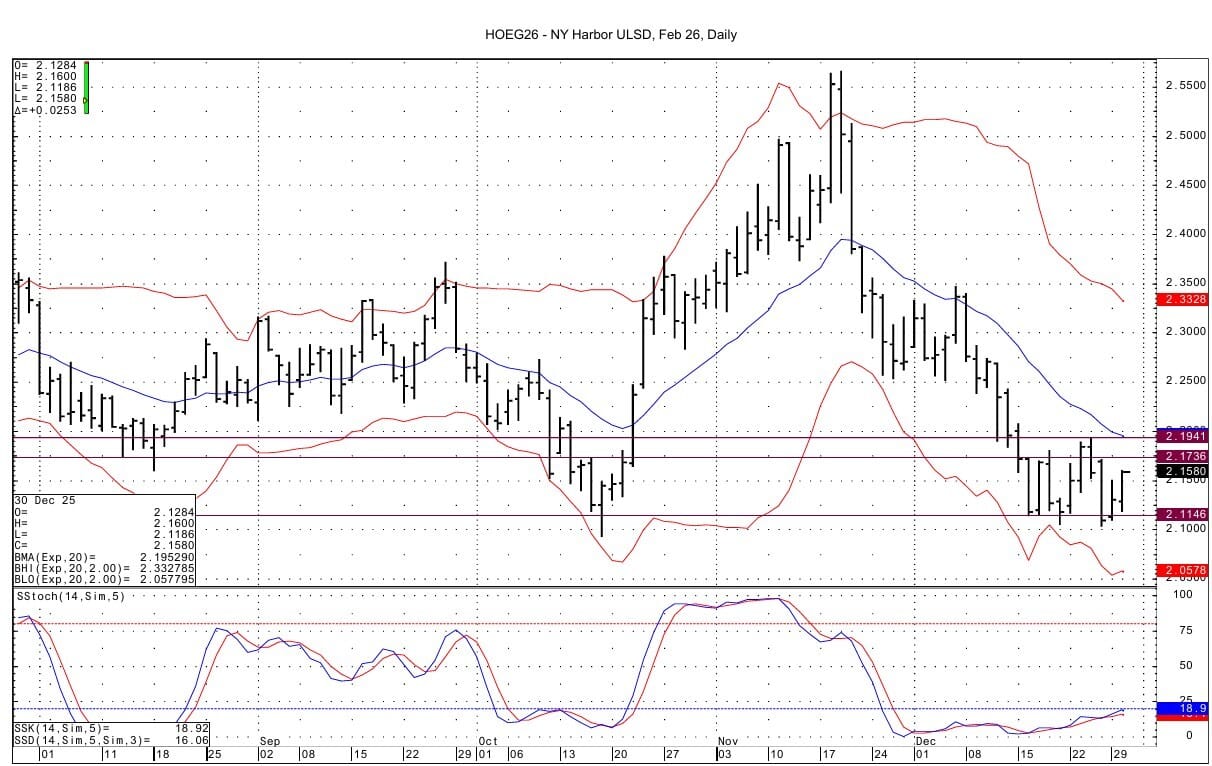
ULSD February futures see support at 2.1146-2.1154. Resistance lies at 2.1718-2.1736 and then at 2.1941.
Natural Gas Market Overview
Natural Gas-- NG is up 16.4 cents at $4.150
NG is higher, continuing the strong pattern seen yesterday as weather forecasts are touting cold temperatures in January.
The EIA storage data seen Wednesday for the week ended Friday December 19 showed a draw of 166 BCF. That was 3 to 4 BCF below forecasts. Total storage fell to 3.413 TCF. That was 24 BCF / 0.70% below the 5 year average. Storage fell to 129 BCF/3.64 % below last year's level. The deficit to the 5 year average is seen flipping back to a surplus with the data for the week ended Dec. 26 due out tomorrow at noon (EST). Estimates seen for tomorrow's data are very varied with estimates of -37 to -64 BCF. Last year's draw was 112 BCF and the 5 year average draw is 120 BCF. NGI sees the upcoming draw as weak due to a 26% decline in heating days in the week ended Dec. 26 from the prior week. Wind output rising by 7% and hydro generation up by 10% in the period are also seen contributing to the weaker storage data, NGI adds. NGI says that gas power generation for the week fell by 20% from the week before. With a view to storage data in the new year, NGI says that the 5 year average storage withdrawals for the period from January 1 to February 20 averaged 171 BCF/ week.
Monday's LNG feedgas demand rose by +0.4 BCF/d to 18.9 BCF/d, up 4.1 BCF/d versus last year & up over 1 BCF/d from last week’s lows. Monday's demand was just 0.3 BCF/d below the daily record. (Celsius Energy)
Forecaster Atmospheric G2 said that colder-than-normal temperatures are expected across the Northeast for January 3-7. (Barchart) Monday saw the HDD demand for the next 2 weeks rise to 412, from Friday's forecast for a reading of 398. Monday's forecast was above the near normal level of 394 HDD's for the period. (Reuters)
NG demand for this week is seen at 138.4 BCF/d, falling next week to 135.8 BCF/d. These forecasts from LSEG were up a total of 1.4 BCF/d from those seen last Wednesday.
TTF options in the April through September strip traded on the CME on Monday. The strip saw the 26/20 Euro put spread trade in a 1 by 2 ratio at a cost of 1.375 Euros with .32 delta futures buys in the strip at Euro 26.75.
On the CME on Monday, the February March CSO calls traded actively. The 50 cent/$1.00 /$1.50 call butterfly traded 6.1 cents cost to the wing buyer. The February March $1.00 call open interest rose by almost 10,000 contracts as a result of Monday's trading. The April October 6 month CSO minus 50 cent puts traded actively at prices of 13.2 and 13.3 cents. The April October futures spread settled at minus 55.1 cents on Monday.
January NG futures expired strongly yesterday, boosted by cold forecasts, strong LNG feedgas volumes and a rise in the Henry Hub next day cash price of $1 from that seen late last week. Henry Hub next day cash prices rose to near $4.400 on Monday, up from Friday's average weighted price of $3.31. January NG futures settled higher by 32.1 cents, while February settled 10.9 cents higher and March settled up 5.6 cents.
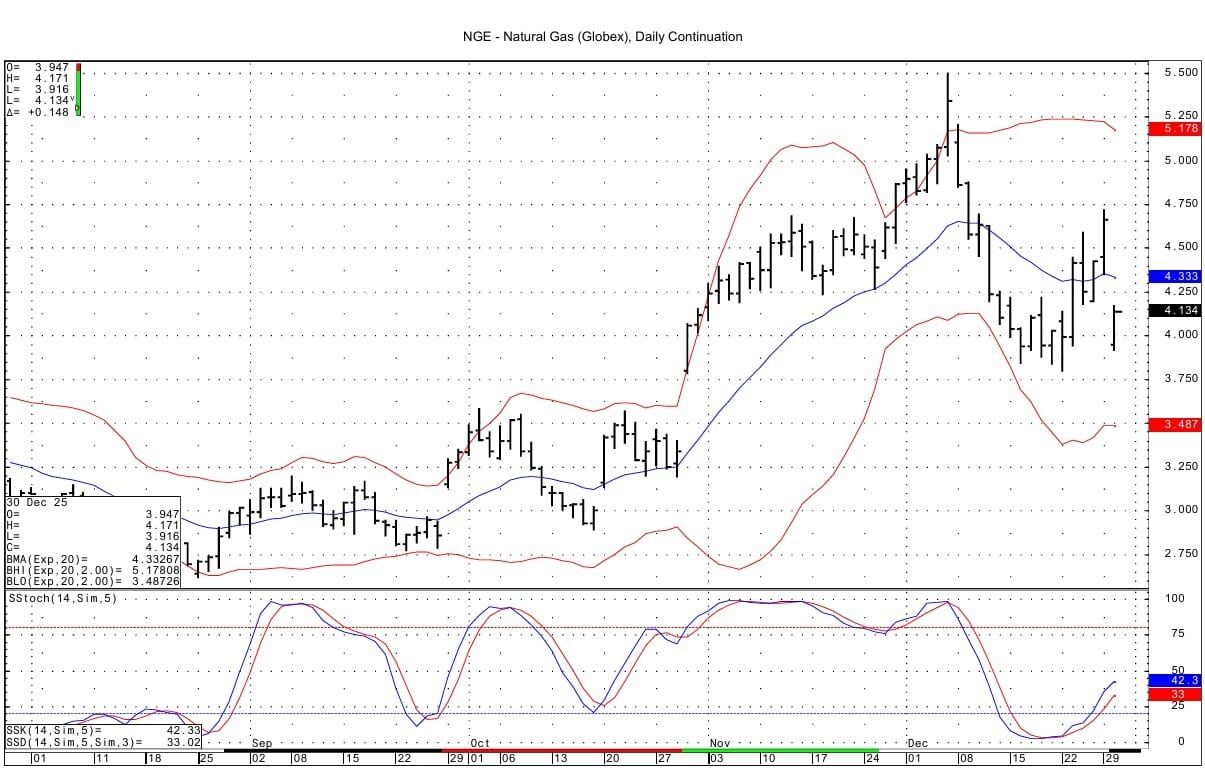
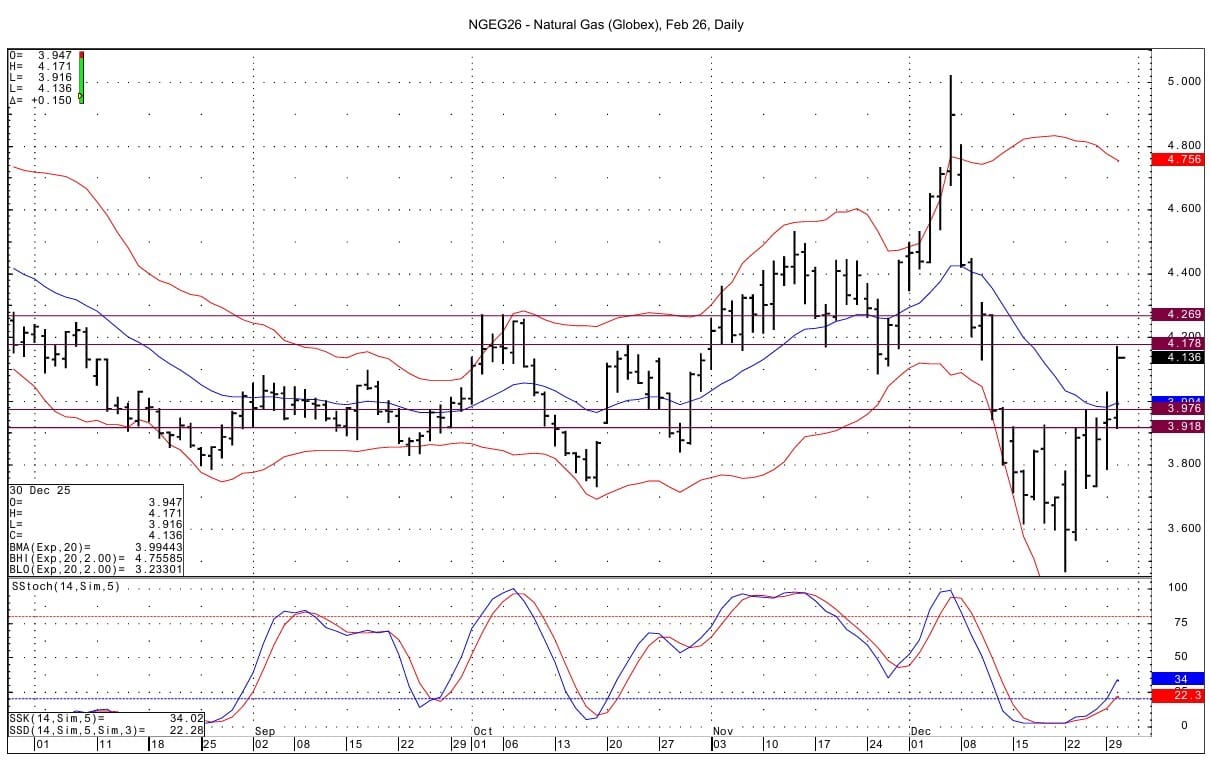
Technically NG has positive momentum basis the DC chart. There is a large rollover gap on the DC chart from the January expiration. The gap goes up to 4.351. Support for the now spot February NG futures lies at 3.976 and then at the overnight low at 3.916-3.922. Resistance at 4.132-4.137 has been pierced. Next resistance lies at 4.178-4.183 and then at the 4.27 area.
Enjoyed this article?
Subscribe to never miss an issue. Liquidity’s Daily Energy Market Updates provide a comprehensive analysis of both the fundamentals and technical factors driving energy markets.
Click below to view our other newsletters on our website:
Disclaimer
This article and its contents are provided for informational purposes only and are not intended as an offer or solicitation for the purchase or sale of any commodity, futures contract, option contract, or other transaction. Although any statements of fact have been obtained from and are based on sources that the Firm believes to be reliable, we do not guarantee their accuracy, and any such information may be incomplete or condensed.
Commodity trading involves risks, and you should fully understand those risks prior to trading. Liquidity Energy LLC and its affiliates assume no liability for the use of any information contained herein. Neither the information nor any opinion expressed shall be construed as an offer to buy or sell any futures or options on futures contracts. Information contained herein was obtained from sources believed to be reliable, but is not guaranteed as to its accuracy. Any opinions expressed herein are subject to change without notice, are that of the individual, and not necessarily the opinion of Liquidity Energy LLC
Reply