- Daily Energy Market Update
- Posts
- Daily Energy Market Update August 7,2025
WTI is up 37 cents RB is up 1.49 cents ULSD is up 1.66 cents
Liquidity’s Daily Market Overview
Energy prices are up today as Chinese crude imports rose in July year on year. Also seen as supportive is the DOE data from yesterday showing a better than expected crude oil draw, as is the higher Saudi OSP's issued yesterday. President Trump also hinted at possible further sanctions against those buying Russian oil --even as news has surfaced of a Trump/Putin meeting in the coming days.
President Trump raised tariffs on India by 25% to a total of 50% on Wednesday. While the first reaction was an up move in oil prices due to worries over supply being reduced, the further reaction was a negative one, as the market interpreted the tariffs as demand weakening. Indicative of the tariff news was ING's commentary: "If India were to stop buying Russian oil amid tariff threats, we believe the market would be able to cope with the loss of this supply,". "It would wipe out the surplus we're expecting in the market through the latter part of this year and much of 2026. This would leave some upside to prices, but a manageable one." ING further commented that firstly, the market is still hopeful that tariffs, effective 27 August, ultimately won’t be implemented. Secondly, the additional tariff won’t push India to stop buying Russian oil.
The U.S. is said to have continued preparations to impose secondary sanctions, potentially including China, to pressure Moscow to end the war in Ukraine, as per Reuters reporting. A Kremlin aide said on Thursday that Trump and Putin will meet in the coming days.
The DOE data was overall supportive, given that crude oil stocks fell more than forecast (even if the draw was a little less than seen in the API data). Also re crude oil, Cushing supplies rose less than seen in the API data. Also supportive is the fact that Distillate supplies fell by 0.565 MMBBL in the DOE data, versus the API build seen prior, and the distillate draw was better than was forecast. Gasoline and distillate supplies fell even in the face of an increase in the percentage capacity usage by refiners. Finished gasoline and distillate production actually fell on the week. Crude oil supplies fell by 3.029 MMBBL, as net crude imports fell by 794 MBPD as crude oil exports rose by 620 MBPD on the week. Product demand was mixed this week--with gasoline demand falling but distillate demand rising. Distillate demand rose on the week by 115 MBPD to 3.72 MMBPD--beating last year's demand by about 250 MBPD--but lagging 2023 by a very small 42 MBPD. Gasoline demand fell on the week by 112 MBPD to a total of 9.04 MMBPD--beating last year's demand by 73 MBPD but lagging 2023 demand by 262 MBPD. The distillate draw led to the best upside reaction among the energies after the stats were released.
The Saudi OSP pricing for September saw the flagship A-Light crude grade to Asian customers rise by $1.00. The Medium crude OSP rose by 90 cents and the Heavy grade rose by 70 cents for the September loadings. The OSP price rise to Asian customers was in line with expectations and thus raised prices to their highest level in 5 months on tight supply and robust demand, as per Reuters reporting one week ago in advance of the official OSP announcement. The OSP hike comes on the heels of an over $1 gain in cash Dubai's premium to swaps this month from last month. Tight supply of Saudi crude was cited as the Saudis kept more crude domestically for consumption. Prices to NW Europe and the Med fell by $1.30 across the board. Prices to the U.S. rose by 30 cents. (Reuters)
China's July crude oil imports rose 11.5% from the same month a year ago as state-owned refineries maintained high operating rates, although the inbound shipments slowed month-on-month after hitting their highest in nearly two years in June. July imports were seen at a pace of 11.12 MMBPD. The imports were down by 5.4% from June. July refinery runs rose year on year by 3.56% and were up 1.02% from June at 71.84%.
The volatility skew for near term crude options has switched back in favor of put options this week amid market excess supply risks. The second month Brent 25 delta call-put volatility spread is today around -1.8% having fallen from near parity early yesterday and a call skew up at +3.55% last week. The WTI spread has switched from +2.8% on July 29 to -2.4% today. The Brent Dec 25 call-put spread is trading at the most bearish since last June with a put skew widening to around -2.25% today while the WTI Dec 25 skew is at -3.4%. (Market News)
Energy Market Technicals
Momentum remains negative for the energies basis the DC charts, although that for the ULSD is getting near oversold.
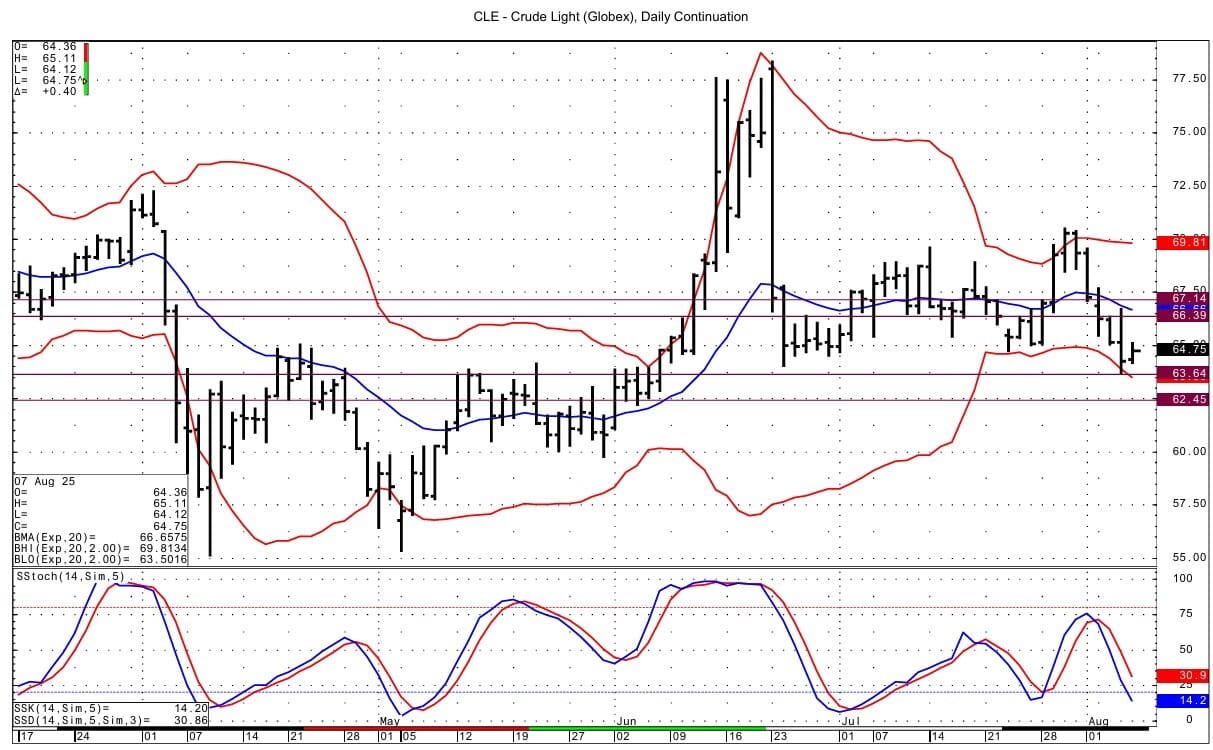
WTI spot futures tested the DC chart lower bollinger band on Wednesday. Support is seen at the Wednesday low of 63.64 and then at 62.45-62.50. Resistance lies at 66.39 and then at 67.13-67.14.
ULSD spot futures see support at the Wednesday low of 2.2391. Resistance is seen at 2.3207-2.3221.

RB for September sees support at 2.0756-2.0761 and then at 2.0585-2.0590. Resistance comes in at 2.1260-2.1261 and then at 2.1513-2.1515.

Natural Gas Market Overview
Natural Gas-- NG is up 2.0 cents
NG spot futures are higher having risen to a fresh high for the week as the market is supported by expectations for a lower than average build in today's EIA storage data and by the forecasts for more hot weather in the Eastern U.S. next week.
The WSJ survey for the NG EIA number for today is calling for a build of 18 BCF. That would be the smallest injection for the period in the past 6 years. Last year saw an increase of 21 BCF. The 5 year average increase is 29 BCF. The forecasted build would be the smallest since April.
Henry Hub next day cash prices rose Wednesday to over $3, thus giving NG futures a boost. The cash futures differential is flat at current after last week when the September NG futures held a premium of 5 cents or more to the next day cash.
Other factors cited for the strength in futures seen Wednesday were the pickup in LNG feedgas volume, a slight dip in gas production and the forecast for some heat in the eastern portion of the US. Washington DC will see highs of 2 to 4 degrees over normal for a stretch of 7 days coming up. Philadelphia will see highs 3 to 6 degrees above normal over a similar period and NY will have highs 5 to 9 degrees above average. Boston will be over normal by 8 to 12 degrees for a short stretch next week. Forecaster Atmospheric G2 said Wednesday that forecasts shifted warmer for much of the U.S. for August 11-15 and shifted warmer over the eastern two-thirds of the country for August 16-20. (Barchart)
LNG feedgas demand has picked up, averaging 15.9 BCF/d so far in August, compared to 15.5 BCF/d in July. This uptick follows the return of Freeport LNG’s Texas facility from outages and strong intake at Venture Global’s Plaquemines plant in Louisiana, which reached a record 3.2 BCF/d. (Reuters)
Bank of America has reduced its natural gas price forecast for September-December 2025 to $3.0/mmbtu, citing persistent loose market balances despite record summer heat. The fourth hottest June-July period in 30 years has been insufficient to tighten the natural gas market, as production growth and power sector looseness exceeded 6 BCF/d year-over-year, outpacing the 3.3 BCF/d increase in LNG demand. BofA analysts project end-of-summer inventories will reach approximately 3.93 Tcf, with western U.S. and Canadian regions rapidly refilling stocks. The bank warns that natural gas could get pushed back to the Midwest and Eastern U.S. this fall. Other estimates we have seen for end of season storage are the EIA's estimate of 3.910 TCF and the Desk's survey estimate of 3.905 TCF. (Investing.com)
Technically in recent days, we have spoken of a range bound NG market and a price waffling around $3. This sentiment seems underscored by a comment seen yesterday: "With this market currently in a low-priced complacent environment, we feel that a sizable miss from average forecasts will be required to swing values much in either direction,". Support is seen at 3.011-3.016 and then at 2.945-2.955. Resistance lies at 3.140-3.145 and then at 3.186-3.187. Momentum is positive for the NG basis the DC chart. Notable are the higher lows seen in the prior 3 sessions.

Enjoyed this article?
Subscribe to never miss an issue. Liquidity’s Daily Energy Market Updates provide a comprehensive analysis of both the fundamentals and technical factors driving energy markets.
Click below to view our other newsletters on our website:
Disclaimer
This article and its contents are provided for informational purposes only and are not intended as an offer or solicitation for the purchase or sale of any commodity, futures contract, option contract, or other transaction. Although any statements of fact have been obtained from and are based on sources that the Firm believes to be reliable, we do not guarantee their accuracy, and any such information may be incomplete or condensed.
Commodity trading involves risks, and you should fully understand those risks prior to trading. Liquidity Energy LLC and its affiliates assume no liability for the use of any information contained herein. Neither the information nor any opinion expressed shall be construed as an offer to buy or sell any futures or options on futures contracts. Information contained herein was obtained from sources believed to be reliable, but is not guaranteed as to its accuracy. Any opinions expressed herein are subject to change without notice, are that of the individual, and not necessarily the opinion of Liquidity Energy LLC
Reply