- Daily Energy Market Update
- Posts
- Daily Energy Market Update August 28,2025
WTI is down 3 cents October RB is down 0.34 cents October ULSD is down 0.24 cents
Liquidity’s Daily Market Overview
RB & ULSD prices are down slightly today, pressured by U.S. summer gasoline demand ending and the return of some oil flows thru a pipeline from Russia to Eastern Europe. Crude oil is near unchanged. RB & the crude oils are having inside trading days today versus yesterday's price range. The backdrop of increased tariffs on India by the U.S. are casting a negative pall, as is the prospect of increased production from OPEC+.
Russian crude supplies to Hungary and Slovakia through the Druzhba pipeline have restarted after an outage caused by a Ukrainian attack in Russia last week, Hungarian oil company MOL and Slovakia's economy minister said on Thursday. (Reuters)
The DOE stats seen Wednesday showed draws across the board, confirming the API data. But, the crude oil draw of 2.392 MMBBL is a bit hard to justify given the rise in supply of 299 MBPD via the net crude imports and the fall in crude inputs to refineries (hence demand) of 328 MBPD. But, Cushing stocks showed the first fall since late June to remain below the seasonal five-year range low, as per Market News commentary. Product demand has risen this week. Gasoline demand is up 398 MBPD to 9.240 MMBPD. We believe that some of the gasoline demand increase may be about moving the higher summer grade RVP product from the refineries to the retail sector before the end of the summer gasoline season requirement. This week's gasoline demand compares to the prior 2 years' demand of 9.307 and 9.068 MMBPD. Distillate demand rose by 174 MBPD this week to 4.141 MMBPD--beating the prior 2 years' demand by 319 and 439 MBPD. Gasoline supplies have fallen to their lowest level since last December according to Market News commentary. They are currently though at the 5 year average seasonally. Distillate supplies fell this week by 1.786 MMBBL, versus forecasts that were calling for a build of between 0.6 and 1.3 MMBBL. Distillate supplies are 15% below the 5 year average seasonally. The drop in distillate supplies this week was driven by lower production, higher exports and a rise in weekly implied demand. The four-week average distillates implied demand extended the recent rally to return above the previous seasonal five-year average and the highest since March, as per Market News commentary.
India is expected to continue buying Russian crude despite the additional 25% tariffs the US imposed Aug. 27, but India may still taper its purchases enough to shift trade flows, and widen price discounts for Russian crude, analysts say. As of the week starting Aug. 20, Indian imports of Russian crude oil dropped to 1.304 MMBPD, down from 1.718 MMBPD the week prior and down from 1.943 MMBPD a year ago, according to S&P Global Commodities at Sea (CAS) data. So far in August, Russia has exported 1.5 MMBPD of crude to India, down from 1.6 MMBPD in July and 1.8 MMBPD in May, as per S&P data. U.S. crude exports to India have risen, averaging 402 MBPD so far in August, up from 161 MBPD in July, CAS data showed. (Platts) Reuters, though, today says that Indian imports of Russian oil will increase in September, as Russian producers cut prices to sell more crude, because they cannot process as much in refineries that were damaged by Ukrainian drone attacks on energy infrastructure. Three trading sources involved in oil sales to India said Indian refiners would increase Russian oil purchases in September by 10-20% from August levels, or by 150 to 300 MBPD.
This week news was seen that, according to Iran’s national oil company NIOC, the country’s oil production soared to the highest level since May 2018, reaching 3.27 MBPD in July, up 190 MBPD on the month as per IEA data. Iran’s average daily crude output rose by 374 MBPD, climbing from 2.88 MMBPD in 2023 to 3.26 MMBPD this year, the latest OPEC Statistical bulletin said. (Oil Price/Tehran Times)
Phillips 66 will begin idling a hydrotreater next week and gasoline/diesel output will indeed be halted by October 1 at its L.A. area refinery. "October (with low RVP) will be wild in CA.”, as per a comment from Tom Kloza, a noted oil analyst. This remains a salient issue in terms of refining margins and PADD 5 gasoline and diesel prices, with supplies already tight and getting tighter amid the loss in capacity. There is very little pipeline capacity from outside California feeding the region, thus it is most likely that imports into the region will have to increase.
Open interest data from the CME for Wednesday's activity shows that WTI open interest rose by 21,956 contracts even as the October contract saw open interest decline by 10,744 contracts. This open interest increase is most notable in the January and February months, which we suspect are mostly new longs given price action. RB open interest fell by 10,877 contracts. This looks mostly to be short covering in the September and October contracts, as well as September expiration related trades.
Energy Market Technicals
The momentum for the October RB & ULSD has turned negative, while that for WTI on the DC chart remains positive.
Despite the positive momentum, WTI spot futures continue to have a sideways trading pattern look. Resistance for the spot futures comes in at 65.09-65.11. Support lies at 63.03-63.06 and then at 62.17-62.19.

October RB sees support at 1.9383-1.9394 and then at 1.9150-1.9166. Resistance lies at 1.9824-1.9839 and then at 2.0003-2.0010.

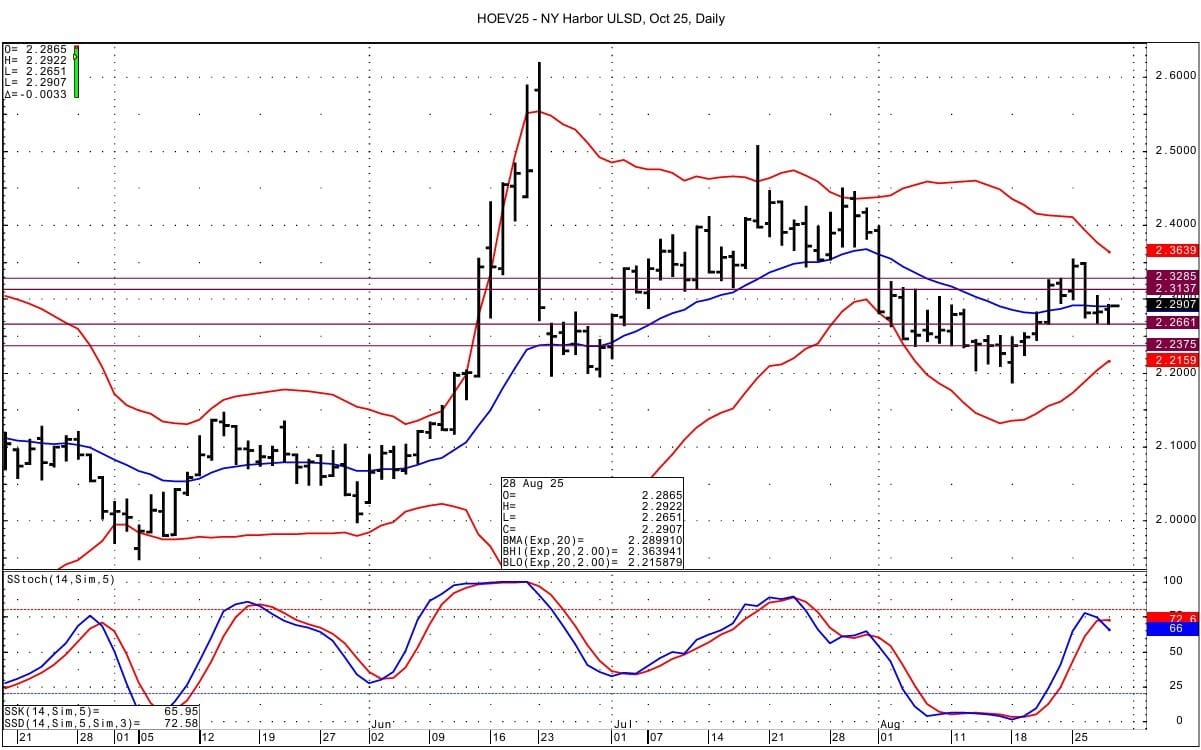
ULSD for October sees support at 2.2644-2.2661, which was tested with the overnight low of 2.2651. Below that support is seen at 2.2364-2.2375. Resistance above lies at 2.3137-2.3152 and then at 2.3264-2.3285.
Natural Gas Market Overview
Natural Gas--NG is down 2.3 cents
October futures are down slightly today after the strong up move upon September's expiration yesterday, that was seen as boosted by short covering and "strong LNG export flows" over 16 BCF/d, as per news wire commentaries. The overnight price range for October futures so far is narrow. The backdrop of overall shoulder season weak weather demand is seen keeping a lid on NG prices.
The EIA storage data due out today is seen as a build of 27 to 28 BCF as per WSJ & Bloomberg surveys. This compares to last year's build of 35 BCF and the 5 year average build of 38 BCF.
The average amount of gas flowing to the eight big U.S. LNG export plants has risen to 15.9 BCF/d so far in August, up from 15.6 BCF/d in July. That compares with a record monthly high of 16.0 BCF/d in April. (Reuters)
LSEG forecasts natural gas demand will fall from 107.1 BCF/d this week to 104.3 BCF/d. These forecasts are up a total of 0.9 BCF/d from those seen Monday.
The NOAA forecasts below normal temperatures for the MidCon and Atlantic seaboard in the 6-10 day period. Also, they say that the Nov-Dec-Jan seasonal temperature outlook is currently showing above normal temperatures as well. New Mexico and West Texas are showing the highest probability of being above normal for the core of the winter.
On Wednesday, LSEG estimated 155 cooling degree days (CDD) over the next two weeks, higher than the 131 CDDs estimated on Aug. 26. The norm for this time of year is 135 CDDs.
Celsius Energy wrote Wednesday:" Net natural gas imports from Canada have weakened over the past 1-2 weeks and are now trailing year-ago levels by -1.2 BCF/d, a reversal from the first half of the year when imports consistently topped 2024 by 1-2 BCF/d. This has helped to blunt the gain in production.
Bloomberg data showed U.S. gas output Wednesday at 107.68 BCF/d versus output of 107.49 on Aug. 20 and down from August 11th data showing output of 109.05 BCF/d.
Wednesday's expiration in September futures was firm and we suspect some investors/traders may have been short going into the expiration, as the September rallied to the point where the September/October spread printed flat in the closing range/last half-hour of the September contract. The spread settled Tuesday at -7.3 cents. Wednesday the spread settled at -1.6 cents, although the last traded price was -3.2 cents.
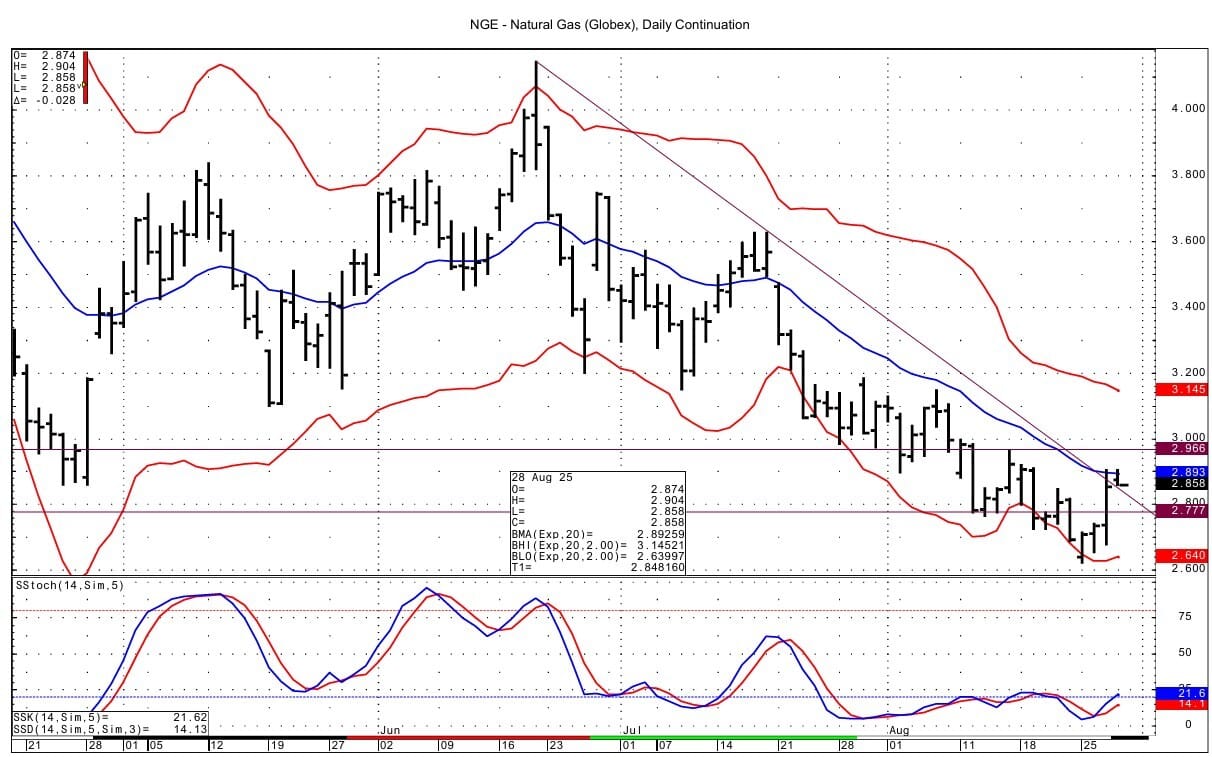
Technically the NG spot futures have positive momentum basis the DC chart. There is no rollover gap from the expiration of the September contract. Supportive for the NG spot futures is the move being seen today and yesterday over a downtrend resistance line on the DC chart off the June high. That downtrend resistance line intersects today at 2.848. There is currently a double top on the DC chart from yesterday/today at 2.906/2.904. Above that resistance comes in at 2.966-2.972. Support lies below at 2.774-2.777.
Enjoyed this article?
Subscribe to never miss an issue. Liquidity’s Daily Energy Market Updates provide a comprehensive analysis of both the fundamentals and technical factors driving energy markets.
Click below to view our other newsletters on our website:
Disclaimer
This article and its contents are provided for informational purposes only and are not intended as an offer or solicitation for the purchase or sale of any commodity, futures contract, option contract, or other transaction. Although any statements of fact have been obtained from and are based on sources that the Firm believes to be reliable, we do not guarantee their accuracy, and any such information may be incomplete or condensed.
Commodity trading involves risks, and you should fully understand those risks prior to trading. Liquidity Energy LLC and its affiliates assume no liability for the use of any information contained herein. Neither the information nor any opinion expressed shall be construed as an offer to buy or sell any futures or options on futures contracts. Information contained herein was obtained from sources believed to be reliable, but is not guaranteed as to its accuracy. Any opinions expressed herein are subject to change without notice, are that of the individual, and not necessarily the opinion of Liquidity Energy LLC
Reply