- Daily Energy Market Update
- Posts
- Daily Energy Market Update August 13,2025
WTI is up 12 cents RB is up 0.80 cents ULSD is down 0.22 cents
Liquidity’s Daily Market Overview
RB & crude oil are higher now after falling overnight with the IEA forecasting a larger oil surplus than they had prior. Supply is set to grow more than three times faster than demand, the IEA said. Also weighing on crude prices is the API data, which showed a build, while forecasts were for a draw in crude supplies.
The IEA said in their monthly oil report today: "Oil market balances look ever more bloated." World oil supply will rise more rapidly than expected this year and next as OPEC+ members further increase output and supply from outside the group grows, the International Energy Agency said on Wednesday. Supply will rise by 2.5 MMBPD in 2025, up from their prior 2.1 MMBPD forecast. Supply will rise by a further 1.9 MMBPD in 2026. The IEA lowered their oil demand growth forecasts for 2025 and 2026 by 20 MBPD. This was the IEA's 5th consecutive month of lowering demand. Demand this year is seen rising by 684 MBPD and by 700 MBPD next year. This year's demand growth is a third less than the IEA projected in January and the weakest pace since 2009, outside of the Covid-19 slump. It cited slowing consumption in China, India and Brazil and noted that all three countries were facing threats of high tariffs on their trade with the US. The agency expects a faster transition to renewable energy sources than some other forecasters. Despite lowering its demand forecast, the IEA expects global crude oil refining rates to approach a fresh all-time high of 85.6 MMBPD in August, after reaching 84.9 MMBPD in July. (Reuters/Financial Times)
API Forecast Actual
Crude Oil -0.3/-1.8 +1.5
Gasoline -0.223/-1.4 -0.9
Distillate -0.2/+0.778 +0.3
Runs -0.7/+0.5% n/av
Cushing n/av -0.6
Highlights from the EIA STEO report issued Tuesday: The EIA sees the 4th quarter crude oil supply over demand rising to 2.0 MMBPD, which is up 800 MBPD from their forecast last month as they see OPEC having "accelerated" the pace of their production increases. Thus, the 2026 price forecasts for Brent and WTI were lowered by $7.05. Brent is seen averaging $51.43 in 2026. The 2026 average for WTI is seen at $47.77. The EIA sees distillate inventories remaining low due to increased exports and lower refining capacity. The EIA sees distillate inventories ending 2025 at their lowest level since 2000. Distillate margins will stay high.
President Trump downplayed expectations for his meeting on Friday with Russian President Putin, saying it is more of a “feel-out meeting” and that he will report back to Ukrainian/European leaders afterwards.
As per EIA data, the benchmark average retail diesel price fell Monday for the third week in a row, catching up to declines in futures markets that prevailed from the end of July and into August. The Department of Energy/Energy Information Administration average weekly retail price, which is the basis for most fuel surcharges, declined 4.6 cents/gallon to $3.754/gallon. Besides being the third consecutive weekly decline, it was also the largest one-week slide since the end of June. The first two of those three were small declines, and the drop over the three weeks is just 5.8 cents/gallon.
Open interest in WTI oil futures on the CME fell by 26,972 contracts in Tuesday's activity. This was a function of the September open interest falling by almost 35,000 contracts as the options on WTI for September expire Friday and the index fund roll is ongoing, as well as possibly longs being liquidated given the recent drop in WTI prices.
Energy Market Technicals
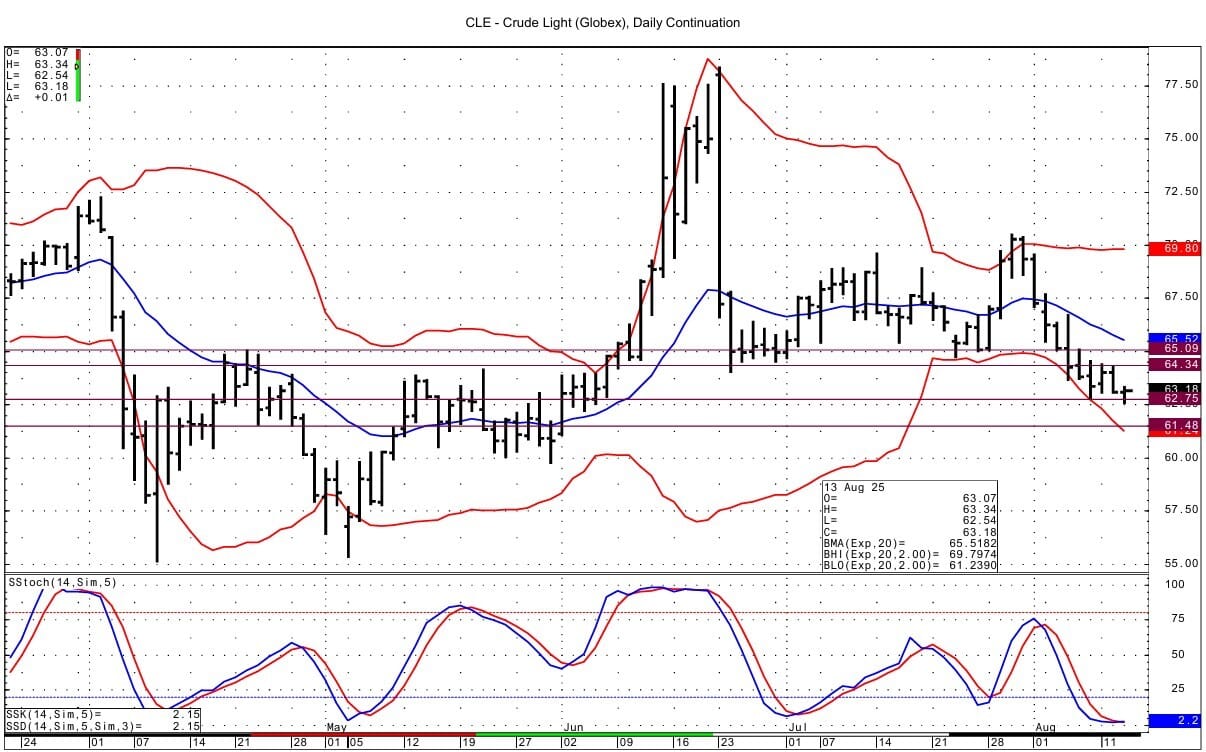
WTI spot futures have fallen today to their lowest value since early June. Spot ULSD futures today are the weakest seen since late June. Momentums for the energies basis the DC charts are basically neutral at near oversold levels.
Spot WTI futures have support at 62.75-62.77, which was tested with a low of 62.54. Below this support is seen at 61.48-61.53. Resistance comes in at the prior 2 highs at 64.44-64.54. Above that resistance is seen at 65.09-65.11.
RB for September has support at 2.0492-2.0506. Resistance lies at 2.1015-2.1021 and then at 2.1239-2.1257.

ULSD September support lies at 2.2200 and then at 2.2023-2.2028. Resistance comes in at 2.2719-2.2728 and then at 2.2936-2.2954.

Notable on the DC Gasoil chart is the rollover gap from August's expiration yesterday. The gap goes up to 671.50. There is resistance below that at 661.75-662.00 basis the DC chart. Support comes in at 647.50-648.50 for the spot Gasoil futures.

Natural Gas Market Overview
Natural Gas--NG is up 1.6 cents
NG futures are higher now after falling overnight as ample supplies of the fuel in storage and forecasts of cooler weather and lower demand than previously expected through late August weighed on prices. This morning's uptick may be some bargain hunting and short covering after the sharp fall in prices the past few sessions. Additionally yesterday the futures to cash differential fell to minus 15 cents from the minus 5 cents seen Monday. This may be too great a differential at present.
LSEG said average gas output in the Lower 48 states has risen to 108.3 BCF/d so far in August, up from July’s record monthly high of 107.9 BCF/d. Back on August 5th, LSEG said August's output was averaging 108.0 BCF/d.
On Tuesday, LSEG projected average gas demand in the Lower 48 states, including exports, would ease to 109.6 BCF/d next week from 110.0 BCF/d this week. These forecasts are down 0.7 BCF/d from those seen Friday.
One bright spot in the NG narrative is the strong LNG feed gas demand. August's average LNG volume has risen to 16.2 BCF/d from July's average of 15.5 BCF/d. August's average is a new record, beating April's record volume of 16.0 BCF/d.
Forecasts for August are on track to be the coolest since 2017, with cooling demand falling 4 BCF/d over the next seven to 10 days, according to EBW analysis.
In the STEO report issued Tuesday, the EIA sees the Q4 natural gas price rising to $3.90 ( from July's price of $3.20) and in 2026 the natural gas price is seen at $4.30. The price is seen going up as production is seen relatively flat while LNG exports are seen increasing. The EIA's price forecasts were lowered by 6 cents for 2025 to $3.61 and by 7 cents for 2026 to $4.34. NG production in the US is seen in 2025 at 106.4 BCF/d, which is up 0.5 BCF/d from July's estimate and for 2026 production is seen at 106.1 BCF/d, which is 0.7 BCF/d more than they predicted in July. Yet, the EIA lowered their EOS storage estimate to 3.872 TCF. This is down 38 BCF from the last month's estimate. That EOS puts them below many other estimates we have seen, which are over 3.9 TCF.
Notable options trades were seen in the October calls and puts and the October/January spread. In the October options, the $3.50/$3.75 call spread was bought at a cost of 3.1 cents. Together with that the $2.75/$2.50 put spread was bought at a cost of 8.15 cents with delta October futures purchased at $2.93. In the October/January calendar spread options, the -$0.80 call was bought against which the -$2.00 put was sold at a cost of 0.3 cents. The October January futures spread settled at $1.337. A small amount of the October/January -$1.30 straddles traded at a cost of 27 cents. We have a few colleagues who believe that the spread still has room to widen favor of January, with one colleague suggesting that the large open interest in the -$1.50 put "will act as a magnet". There are nearly 23,000 contracts open in the October/January -$1.50 put strike.
Natural gas futures open interest on the CME rose by over 23,000 contracts in Tuesday's trading, even as September 2025 open interest fell by over 16,000 contracts. We see possible new shorts having been added in October, November and January.
Today's spot NG futures are at their lowest since November 15. Support at 2.769-2.772 has been tested with a current low seen today of 2.764. Below this support is seen at 2.688. The supports are from data from Nov. 2024. Resistance lies at 2.881-2.887. Momentum has turned negative with the steep drop in prices seen the past few sessions. One supportive element technically if prices fall could be the weekly continuation chart's lower bollinger band, which intersects near 2.74.


Enjoyed this article?
Subscribe to never miss an issue. Liquidity’s Daily Energy Market Updates provide a comprehensive analysis of both the fundamentals and technical factors driving energy markets.
Click below to view our other newsletters on our website:
Disclaimer
This article and its contents are provided for informational purposes only and are not intended as an offer or solicitation for the purchase or sale of any commodity, futures contract, option contract, or other transaction. Although any statements of fact have been obtained from and are based on sources that the Firm believes to be reliable, we do not guarantee their accuracy, and any such information may be incomplete or condensed.
Commodity trading involves risks, and you should fully understand those risks prior to trading. Liquidity Energy LLC and its affiliates assume no liability for the use of any information contained herein. Neither the information nor any opinion expressed shall be construed as an offer to buy or sell any futures or options on futures contracts. Information contained herein was obtained from sources believed to be reliable, but is not guaranteed as to its accuracy. Any opinions expressed herein are subject to change without notice, are that of the individual, and not necessarily the opinion of Liquidity Energy LLC
Reply