- Daily Energy Market Update
- Posts
- Daily Energy Market Update August 12,2025
In partnership with
WTI is down 39 cents RB is down 0.58 cents ULSD is down 2.27 cents
Liquidity’s Daily Market Overview
Crude oil and distillates are lower, while RB is near unchanged as the watch word in news wire commentary today for the crude oil is "steady". The market was awaiting the OPEC and EIA monthly reports and US CPI data.
OPEC --in their monthly oil report released a few minutes ago--kept their 2025 oil demand growth forecast unchanged at +1.29 MMBPD. They also kept their Non OPEC oil supply growth estimate for 2025 unchanged at +810 MBPD. But, they lowered their Non OPEC supply growth estimate for 2026 by 100 MBPD to +630 MBPD. And they raised their oil demand growth forecast for 2026 by 100 MBPD to +1.38 MMBPD.
US CPI data comes in as expected. July saw inflation up 0.2% and +2.7% year on year. These figures may give the Federal Reserve some room to cut rates in September, thus giving WTI a small bump after the CPI data was released.
The U.S. & China have extended their tariff truce by 90 days. This is seen as supportive for the energies. President Trump extended a tariff truce with China to November 10, staving off triple-digit duties on Chinese goods as U.S. retailers prepared for the critical end-of-year holiday season. (Reuters)
Potentially weighing on the oil market, Presidents Trump and Putin are due to meet in Alaska on Friday to discuss an end to the war in Ukraine. "If Friday's meeting brings a ceasefire or even a peace deal in Ukraine closer, Trump could suspend the secondary tariffs imposed on India last week before they come into force in two weeks,", as per one analyst. But, the analyst adds : "If not, we could see tougher sanctions against other buyers of Russian oil, like China". Ukraine has signaled that it will reject any deal that requires it to give up territory to Russia. (Investing.com)
OPEC+ crude output fell to 41.65 MMBPD in July, the Platts OPEC+ Survey from S&P Global Commodity Insights showed yesterday. The output fell by 190 MBPD, driven by a 300 MBPD drop by Saudi Arabia, which had increased production in June to protect against supply disruptions.
According to Euroilstock data, submitted by 14 major EU member countries and the UK and Norway, middle distillates inventories were pegged at 369.97 MMBBL in July, down 0.6% from April and 6% below the same time last year. The total was the lowest since November 2023 and the lowest July reading since 2009. (Quantum Commodities)
Energy Market Technicals
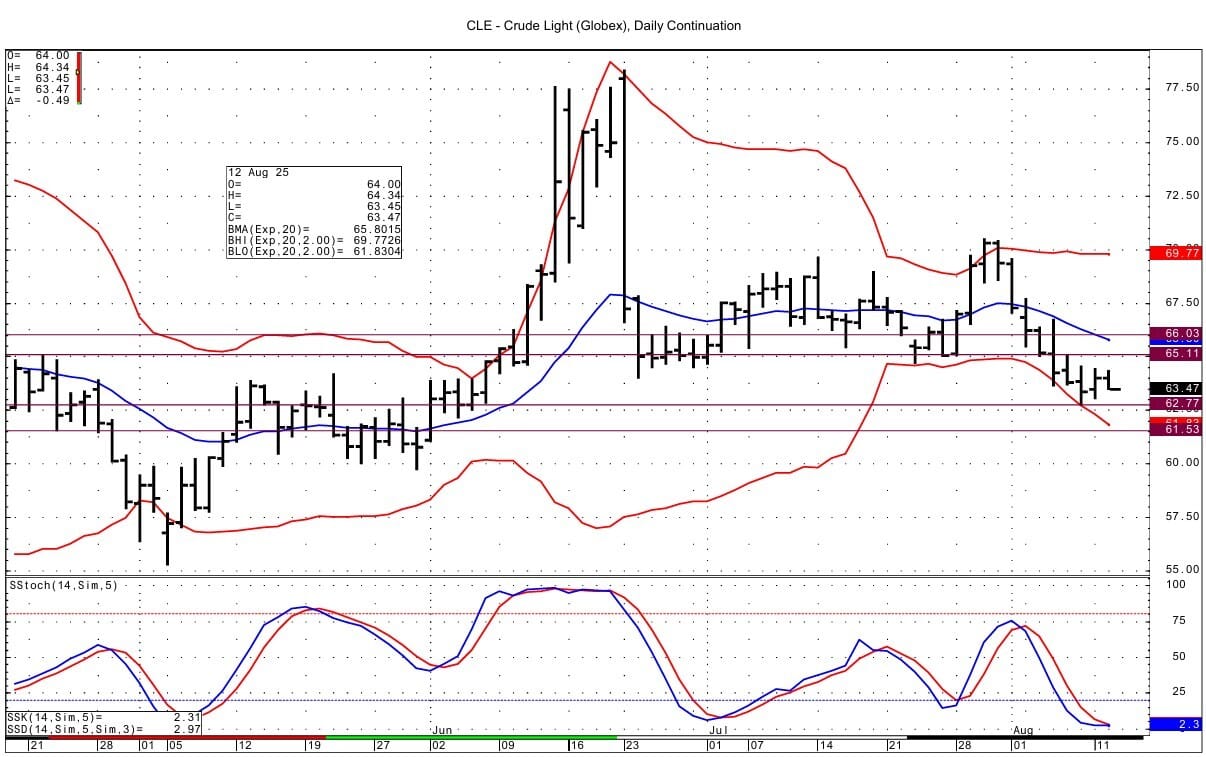
The markets are currently having inside trading days versus yesterday's trading ranges. RB and crude oil momentums on the DC charts are oversold and look poised to turn positive. ULSD momentum basis the DC chart is positive.
WTI spot futures see support at 62.77-62.82 and then at 61.48-61.57. Resistance lies at 65.09-65.11 and then at 65.99-66.03.
RB for September sees support at 2.0585-2.0590 and then at Friday's low at 2.0492. Resistance comes in at 2.1055-2.1061 and then at 2.1239-2.1257.

ULSD spot futures see support at 2.2458-2.2472 and then at 2.2200. Resistance comes in at 2.2985-2.3008 and then at 2.3185-2.3207.

Natural Gas Market Overview
Natural Gas--NG is down 3.2 cents
NG spot futures are lower today continuing to trade under $3 as weather forecasts for later in August fail to impress and NG production remains strong. But, hot weather is still ongoing, providing some support.
Early Monday morning, the next day Henry Hub cash natural gas was quoted 3.01 / 3.03 versus NG September printing 2.955. This is the first time since early April that we have seen the cash over the screen. This is likely a function of the hotter weather conditions currently seen in the Eastern half of the country, while the forecast for later in the month is cooler, thus giving the futures a more negative tone.
Bloomberg data had Monday natural gas production at 109.05 BCF/d, down from the prior day's level of 110.03 BCF/d. These are strong production figures versus the figures seen last Monday and Tuesday of 108.91 and 108.02 BCF/d.
Forecaster Vaisala said Monday that forecasts shifted cooler over the eastern US for August 16-20. (Barchart)
Early estimates seen for this week's EIA storage data are calling for a build of 52.5 to 59 BCF. This compares to last year's draw of 2 BCF and the 5 year average build of 33 BCF. NGI suggests that continued above average injections will see end of season (EOS) inventories reach 3.952 TCF, which would be the second highest total since 2010, they add. NGI even suggests that the EOS may be higher given that production is up over 6 BCF/d versus year ago level. The Desk's survey for EOS is calling for a total of 3.918 TCF.
We heard differing views of the NG market yesterday: "market ripe this week to break the 2.88 support IF weather continues to moderate as forecasted over weekend."versus "I’m leaning toward (the market) holding here on strong LNG, another “relatively “ low storage injection number, and a crowded short position by specs."
Chinese demand for liquefied natural gas is expected to remain soft in the coming months, contributing to lower prices throughout 2026, according to Capital Economics. LNG imports fell by about 11% on year in June, marking the eighth consecutive monthly decline. “Year-to-date, this brings the fall in imports to over 21% in 2025,” says Lily Millard. “It’s not just LNG imports that have fallen; total natural gas imports have fallen by nearly 8% year-to-date and domestic production has not offset that decline.” Chinese industrial activity is expanding at its slowest pace since early 2023, and a strong rebound in industrial gas demand appears unlikely in the near term, according to the economist. Meanwhile, the share of renewables in China’s energy mix is set to continue growing this decade, further limiting the role of natural gas. (wsj.com)
Notable in the LN/NG options on the CME on Monday were trades in the September/October and February/March 1 month calendar spread options. In the September/October options, the -5 cent/flat call spread traded 0.7 cents. The - 5 cent option trade was an opening position. The -5 cent put in the September/October calendar spread traded 5.4 cents in what was a closing out of the position, basis CME open interest data. The September October futures spread settled Monday at -9.9 cents. 5,000 contracts of the February/March 25 cent/10 cent put spread traded 6 cents in what was an opening position trade. The February March NG futures spread settled Monday at 43.0 cents.
Technically the NG futures have positive momentum basis the DC chart. But is continuing to settle under $3 a negative factor? Currently today the NG is having an inside day versus yesterday's trading range. Support lies at Sunday night's low at 2.881 and then at the major lows at 2.858-2.859. Resistance comes in at 3.011-3.016.

Enjoyed this article?
Subscribe to never miss an issue. Liquidity’s Daily Energy Market Updates provide a comprehensive analysis of both the fundamentals and technical factors driving energy markets.
Click below to view our other newsletters on our website:

Join over 4 million Americans who start their day with 1440 – your daily digest for unbiased, fact-centric news. From politics to sports, we cover it all by analyzing over 100 sources. Our concise, 5-minute read lands in your inbox each morning at no cost. Experience news without the noise; let 1440 help you make up your own mind. Sign up now and invite your friends and family to be part of the informed.
Disclaimer
This article and its contents are provided for informational purposes only and are not intended as an offer or solicitation for the purchase or sale of any commodity, futures contract, option contract, or other transaction. Although any statements of fact have been obtained from and are based on sources that the Firm believes to be reliable, we do not guarantee their accuracy, and any such information may be incomplete or condensed.
Commodity trading involves risks, and you should fully understand those risks prior to trading. Liquidity Energy LLC and its affiliates assume no liability for the use of any information contained herein. Neither the information nor any opinion expressed shall be construed as an offer to buy or sell any futures or options on futures contracts. Information contained herein was obtained from sources believed to be reliable, but is not guaranteed as to its accuracy. Any opinions expressed herein are subject to change without notice, are that of the individual, and not necessarily the opinion of Liquidity Energy LLC
Reply