- Daily Energy Market Update
- Posts
- Daily Energy Market Update April 2,2026
July 9, 2026
WTI is up $13.00 at $113.12 RB is up 19.00 cents at $3.2814 ULSD is up 54.33 cents at $4.6001
Liquidity’s Daily Market Overview
Energies are up strongly as President Trump, in his address to the American people, did not give an offramp to the Iran conflict. The markets have instead seen the other side with his threats to hit Iran "extremely hard".
In his address Wednesday night, President Trump said that while the U.S.'s core strategic operations were nearing completion, the military is going to hit Iran "extremely hard over the next two to three weeks." He also said that the US could target “each and every one” of the country’s power plants. (ING/WSJ) "The Strait of Hormuz is still effectively closed, and the baseline assumes that it won't change until the end of April.", as per one analyst's commentary. Britain is hosting a virtual meeting of 35 countries to discuss options for reopening Hormuz. The United States is not due to attend. (Reuters)
Iranian Revolutionary Guard Corps sources maintained as of April 1 that the Strait of Hormuz will not open based on Trump’s ‘absurd’ displays. Iran has already passed a law introducing a toll, which would require any ship wanting to pass to share detailed information and hand over fees in local currency, formalizing the current status quo. (Market News)
Russian oil output cuts are imminent due to Ukraine’s strikes on port infrastructure, which have reduced export capability by 1 MMBPD, or 20% of capacity, Reuters reports citing three industry sources.
The DOE stats showed a build in crude supplies, that we find somewhat hard to justify. Net crude imports fell by 209 MBPD, which was offset by the decline in refinery runs of 219 MBPD. US crude production was unchanged. Thus, a build of 5.45 MMBBL is hard to fathom. Crude supplies rose to their highest level since June 2023. (ING) Distillate supplies fell by 2.0MMBBL and distillate demand rose back over 4.0 MMBPD, which saw ULSD futures rise firmly post data release. The distillate draw was better than forecast. Distillate demand rose by 471 MBPD on the week to 4.039 MMBPD, beating the prior 2 years demand by 360 and 533 MBPD. Gasoline supplies fell by 0.586 MMBBL. Gasoline demand on the week fell by 238 MBPD to 8.680 MMBPD, still beating last year's demand by 185 MBPD, but lagging 2024 demand by 556 MBPD. Cushing stocks rose by 520 MBBL to 31.5 MMBBL, also the highest since July 2024. (ING)
Despite President Trump's statement that the US has plenty of jet fuel for those foreign nations that need it --data seen shows a different story. About 0.5 MMBPD of jet fuel is normally exported out of the Strait of Hormuz, mainly to Europe and some to Asia and Africa, data from vessel-tracking service Kpler shows. Total U.S. jet fuel exports, meanwhile, averaged 219 MBPD last year, data from the EIA shows. The US is the top consumer of jet fuel globally, and most of the jet fuel the country produces is consumed domestically, EIA data shows. Last week, refiners and fuel blenders produced 1.97 MMBPD of jet fuel, which was just slightly above demand of 1.79 MMBPD, EIA reported. Most U.S. jet fuel production is concentrated in the U.S. Gulf Coast, and major demand centers along the country's East Coast and West Coast have historically relied on imports to cover their needs. The West Coast normally gets imports from Asia. At least four to five cargoes of jet fuel and diesel were loaded in the New York Harbor region for delivery to Europe, reversing the typical flow that sees these products come from Europe to the U.S. East Coast, top oil analyst Tom Kloza said. Wholesale jet fuel prices are at between $4 and $5 a gallon in most areas of the United States, according to GasBuddy data. For comparison, the typical cost of jet fuel in the U.S. Gulf Coast is between $2.50 and $3 a gallon, as per analysis from GasBuddy.(Reuters)
OPEC is considering a further oil output hike at their meeting this Sunday. One Reuters source said OPEC+ would likely agree to an increase that would have little immediate impact on supply but would signal readiness to raise output once tankers are able to resume shipments through the strait.
U.S. refined products exports hit a record high in March, as the world sought fuels due to the global disruption of crude and refined product supplies. U.S. exports of clean petroleum products, which include gasoline, naphtha, diesel and jet fuel, hit about 3.11 MMBPD in March, up from about 2.5 MMBPD in February, data from vessel-tracking service Kpler showed. That is the highest monthly level in Kpler records going back to 2017. U.S. fuel exports to Europe rose nearly 27% month-over-month to 414 MBPD in March, while exports to Asia more than doubled to 224 MBPD, the Kpler data showed. Exports to Africa surged 169% to 148 MBPD, the data showed.
India's diesel exports to Southeast Asia surged to the highest in more than seven years at about 1 million metric tons, or 7.45 MMBBL in March, Reuters said based on Kpler data. Supply has pivoted to cover short positions and with more profitable sales to Asia due to higher prices as those refiners have cut output and countries including China ban exports of refined products.
China’s crude throughput is expected to drop almost 6% year on year in 2026 to 680 million metric tons, or about 13.7 MMBPD, due to sustained Middle East supply disruption, according to JLC cited by Bloomberg. Chinese independent “teapot” refiners are expected to cut crude runs in April as sanctioned crude prices surge and domestic fuel demand remains weak, Reuters reported. Analysts expect run rates to fall to around 50%, down from about 55% in February and March. The Russian ESP crude grade price to China has swung from a $8 discount versus Brent crude to a plus $8 price. (Market News)
Oil tanker availability along the U.S. Gulf Coast has dropped sharply in recent weeks, as Asian and European refiners cut off from Middle Eastern supply have been snapping up vessels to import oil and fuel from the United States, shipping analysts and traders said. "The resulting surge in freight rates is unprecedented, with Suezmaxes and Aframaxes earning upwards of $300,000, compared to an average $60,000 over the past five months,", as per one tanker company CEO. The movement of cargoes from the West to the East, starting with VLCCs to Asia and then smaller sizes catering to European demand, gave birth to an unprecedented surge in freight rates, as per one shipping analyst. (Reuters)
Corpus Christi Refineries and Port Face Curtailments with Water Crisis: Corpus Christi refineries are working to secure alternative supplies of water to maintain operations and avoid shutting down due to the impending water shortage facing the region, according to the AP. The scenario projects the city hitting a level 1 water emergency by May 2026, which means the city is 180 days from demand exceeding supply. The official curtailment measures are still being discussed, focusing on whether to implement a flat percentage or a prioritization schedule that favors refineries over other industrial users. The region’s refining capacity is close to 1 MMBPD of refined products per day, including 450 MBPD of gasoline, as per data from the Texas Oil & Gas Association.
The prices for retail gasoline and diesel fuels in the US have risen further today. The average gasoline price is up 1.7 cents today to $4.081, which is up $1.099 from February 27. Diesel fuel is averaging $5.507 today, as per AAA data. That is up 1.7 cents from yesterday and up $1.75 from February 27.
Energy Market Technicals
The spot WTI futures are testing the DC chart's upper bollinger band as the contract has risen to its best spot futures value since the spike high seen March 9th. WTI's DC chart based momentum is positive, while that for the products is neutral.
WTI spot futures see resistance at 113.41 and then at 119.48. Support lies at 108.86-106.93 and then at 104.50-104.51.


RB spot futures see resistance at the overnight high at 3.3167-3.3179 and then at 3.3480. Support lies at 3.2453-3.2461 and then at 3.2031-3.2043. The DC chart gap to 3.2663 from the April expiration was filled today.


ULSD spot futures see support at 4.4883 and then at 4.4214-4.4215. The overnight low for the May ULSD is 3.9858. Resistance comes in at 4.6575 and then at 4.7061 from DC chart data.


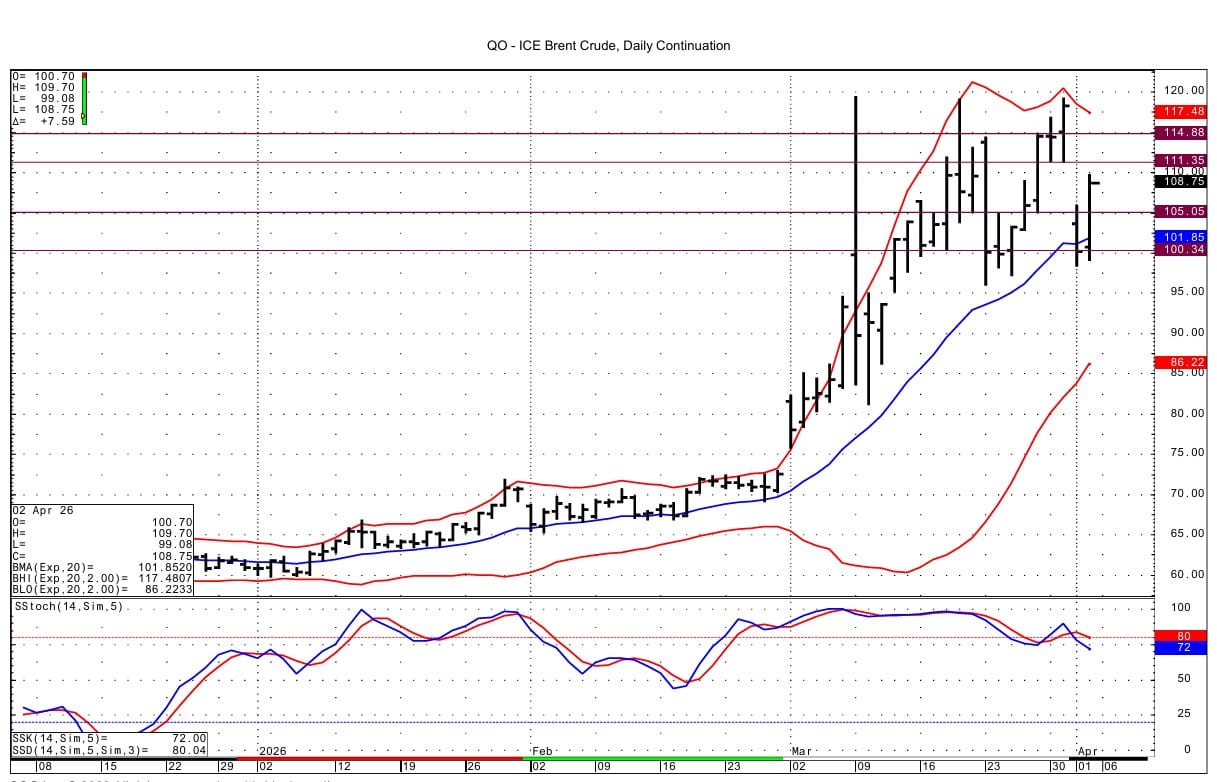
The Brent spot futures have a gap to fill on the DC chart from the May expiration. The gap goes up to $111.35. DC chart based momentum is negative due to the premium that was lost with the May futures expiration.
Natural Gas Market Overview
Natural Gas--NG is up 2.9 cents at $2.848
The NG and TTF gas futures are higher -- but are lagging behind the strong energy complex rally. NG's rally is muted as shoulder season weather demand is a weight. NG feedgas demand is a positive, especially as LNG global disruptions persist.
U.S. exports of LNG rose to an all-time high in March as plants ran above nameplate capacity and new units started up, preliminary data from financial firm LSEG showed. Exports in March climbed to 11.7 million metric tons, up from 9.94 million tons in February, and surpassed the previous monthly record of 11.5 million tons in December, the data showed. And new production capacity is ramping up at Cheniere's Corpus Christi plant and at the Golden Pass facility. U.S. shipments to Asia rose to 1.99 million tons (=95.5 BCF) in March, more than double the 970,000 tons sent in February, LSEG ship-tracking data showed. Europe remained the largest buyer of U.S. LNG last month, taking 7.49 million tons (=360 BCF), or about 64% of total March exports. That was slightly below the 7.66 million tons (=367 BCF) shipped in February. (Reuters)
Today's EIA gas storage data is seen as a build of 22 BCF, as per the WSJ survey. But surveys from Bloomberg and Reuters are calling for a build of 34 to 36 BCF. This compares to last year's build of 30 BCF and the 5 year average for the period that is a draw of 4 BCF.
The near-term temperature outlook continues to look consistently mild through at least mid-April, as per Celsius Energy analysis. LSEG figures showed NG demand forecasts seen on Wednesday for this week were estimated at 107.8 BCF/d and 106.8 BCF/d for next week. These forecasts were down a total of 4.3 BCF/d versus those seen Monday.
The October January CSO options traded actively Wednesday on the CME. The -$1.00/-$0.75 call spread traded 4.1 cents 2,500 contracts worth. Furthermore, the October January -$1.50 call was sold against buying of the -$1.50 put at a cost of 0.2 and 0.3 cents. Against that, an equal amount of the October January futures spread was sold at -$1.50. 2,000 contracts of the October January -$2.00/-$1.75/-$1.50 put butterfly traded at a cost of 2.9 cents. Also in the October January CSO, 3,000 of the -$1.50/-$1.25/-$1.00 call butterfly traded at a cost of 3.7 cents. On Wednesday, the October January futures spread settled at -$1.561.
In the TTF options on the CME on Wednesday, the June 50/60/70 Euro call butterfly traded at a cost of 1.0 Euro to the buyer of the wings. There were 0.10 delta June TTF futures sales at Euro 48.50 against that. The June TTF settled at Euro 47.364 Wednesday; currently today the June TTF futures are printing Euro 50.480.
Technically the NG futures have negative momentum basis the DC chart. Support lies at 2.772-2.776. Resistance is seen at 2.944-2.949.

Enjoyed this article?
Subscribe to never miss an issue. Liquidity’s Daily Energy Market Updates provide a comprehensive analysis of both the fundamentals and technical factors driving energy markets.
Click below to view our other newsletters on our website:
Disclaimer
This article and its contents are provided for informational purposes only and are not intended as an offer or solicitation for the purchase or sale of any commodity, futures contract, option contract, or other transaction. Although any statements of fact have been obtained from and are based on sources that the Firm believes to be reliable, we do not guarantee their accuracy, and any such information may be incomplete or condensed.
Commodity trading involves risks, and you should fully understand those risks prior to trading. Liquidity Energy LLC and its affiliates assume no liability for the use of any information contained herein. Neither the information nor any opinion expressed shall be construed as an offer to buy or sell any futures or options on futures contracts. Information contained herein was obtained from sources believed to be reliable, but is not guaranteed as to its accuracy. Any opinions expressed herein are subject to change without notice, are that of the individual, and not necessarily the opinion of Liquidity Energy LLC
Reply