- Daily Energy Market Update
- Posts
- Daily Energy Market Update April 10, 2026
July 9, 2026
Liquidity’s Daily Market Overview
Oil markets are heading for their largest weekly decline in roughly 10 months, with Brent and WTI down about 11–12%, after a two-week ceasefire agreement between the United States and Iran, brokered by Pakistan. The truce has eased immediate fears of prolonged disruption, triggering a sharp selloff in futures, even as prices remain near the $100 per barrel level.
Despite that drop, underlying supply conditions remain severely constrained. Traffic through the Strait of Hormuz—a critical artery for roughly 20% of global oil flows—is still running at less than 10% of normal levels. Iran continues to exert control over the passage and has floated the idea of charging transit fees, reinforcing uncertainty and keeping the physical market tight.
At the same time, regional infrastructure damage is compounding supply risks. Attacks on facilities operated by Saudi Aramco have cut around 600,000 barrels per day of production, while broader strikes across the Gulf region have taken roughly 2.4 million barrels per day of refining capacity offline. Key transport routes, including Saudi Arabia’s East-West Pipeline, are also operating below normal levels.
Even so, producers are beginning to position for a potential recovery in flows. Saudi Aramco has asked buyers to submit May loading schedules, including shipments that would rely on Hormuz reopening, while exporters in Kuwait and Iraq are preparing cargo programs. Trading firms such as Glencore have already started securing tankers in anticipation of resumed exports.
The result is a growing disconnect: futures markets are pricing in de-escalation and normalization, while the physical market continues to reflect acute scarcity. The near-term direction for crude will hinge on whether flows through the Strait of Hormuz actually resume in a meaningful way.
Energy Market Technicals

Crude (CL1)
Crude respected its first Fibonacci level at 101.20 yesterday, briefly trading through it before selling off $6. So far this morning, we’re seeing an inside day as the market looks for the next headline on the ceasefire. Momentum has moved out of overbought territory and is trending toward neutral. One thing to watch: we’ve now had three consecutive closes below the 20-day moving average. Prior to this stretch, price had not closed below the 20-day since mid-February.
Key levels to watch remain:
Resistance
101.20 38.2% Fibonacci
104.34 50% Fibonacci
107.48 61.8% Fibonacci
Support
84.98 Lower Bollinger Band
84.21 March 23 low
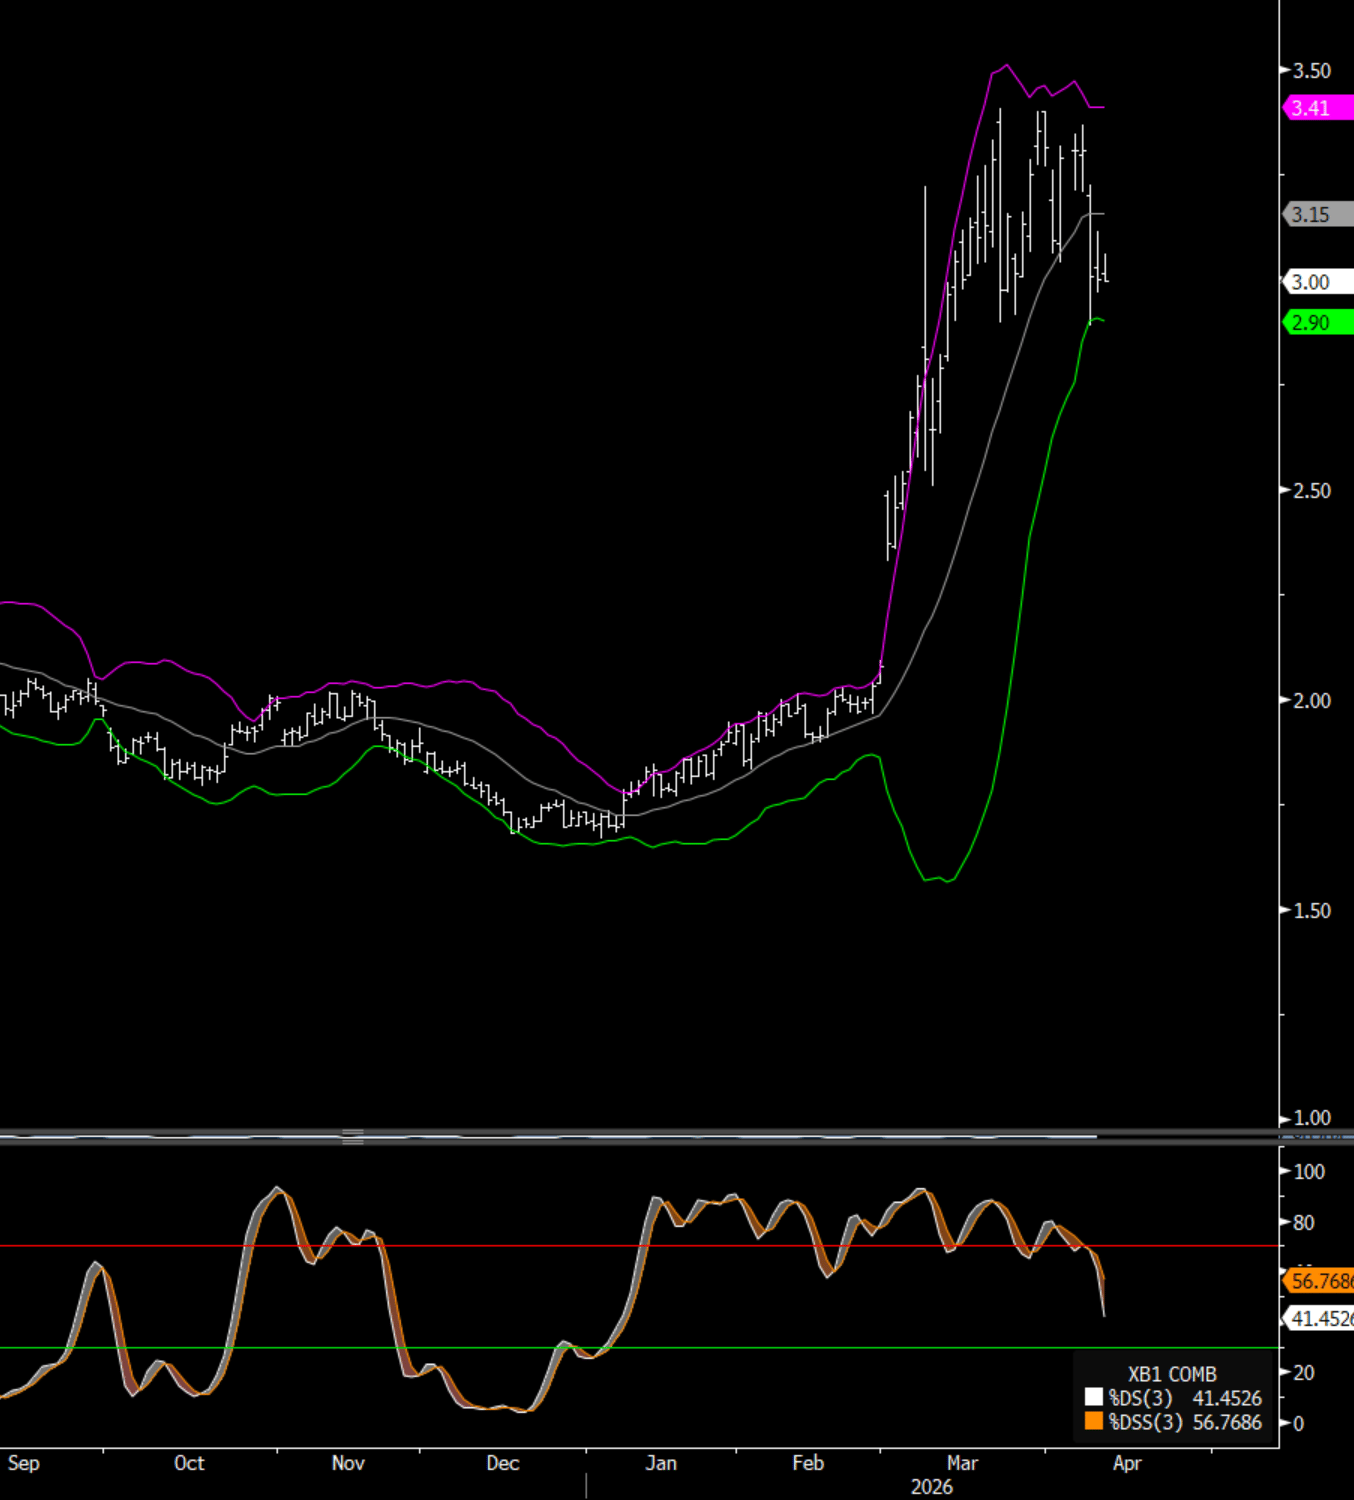
RBOB (XB1)
RBOB momentum has moved into it neutral zone while price sits near it’s lower Bollinger Band. We have also seen 3 consecutive closes below the 20 day moving average. The last time price closed below the 20 day moving average was January 7. Today price is also having an inside day

ULSD (HOK6)
ULSD (HOK6) is having an inside day and momentum is also in the neutral zone. Watching for potential acceleration if we see a break above/below yesterdays range.
Natural Gas Market Overview
Asian LNG prices are moving higher, rising by mid-single digits this week, as ongoing disruptions in the Strait of Hormuz continue to tighten prompt supply. Despite a ceasefire between the United States and Iran, the waterway remains largely blocked, with LNG flows still severely curtailed and a meaningful portion of global supply impacted.
The strength reflects tighter near-term availability, with buyers remaining active in the spot market, even as prices have eased slightly from recent peaks on cautious optimism around de-escalation.
Attention now turns to upcoming talks in Islamabad, where U.S. Vice President JD Vance is expected to lead negotiations, with reopening Hormuz a key focus. Until flows normalize, LNG markets are likely to stay firm and driven by geopolitical headlines.

Nat Gas (NGK26)
Natural Gas is making new lows this morning breaking below yesterday’s low and currently sitting on the lower Bollinger Band (2.64). Momentum remains deeply oversold. Watching to see if it can print a reversal bar today with a close over yesterday’s close at 2.67.
Enjoyed this article?
Subscribe to never miss an issue. Liquidity’s Daily Energy Market Updates provide a comprehensive analysis of both the fundamentals and technical factors driving energy markets.
Click below to view our other newsletters on our website:
Disclaimer
This article and its contents are provided for informational purposes only and are not intended as an offer or solicitation for the purchase or sale of any commodity, futures contract, option contract, or other transaction. Although any statements of fact have been obtained from and are based on sources that the Firm believes to be reliable, we do not guarantee their accuracy, and any such information may be incomplete or condensed.
Commodity trading involves risks, and you should fully understand those risks prior to trading. Liquidity Energy LLC and its affiliates assume no liability for the use of any information contained herein. Neither the information nor any opinion expressed shall be construed as an offer to buy or sell any futures or options on futures contracts. Information contained herein was obtained from sources believed to be reliable, but is not guaranteed as to its accuracy. Any opinions expressed herein are subject to change without notice, are that of the individual, and not necessarily the opinion of Liquidity Energy LLC
Reply